What R can do?
- for fun
- for data
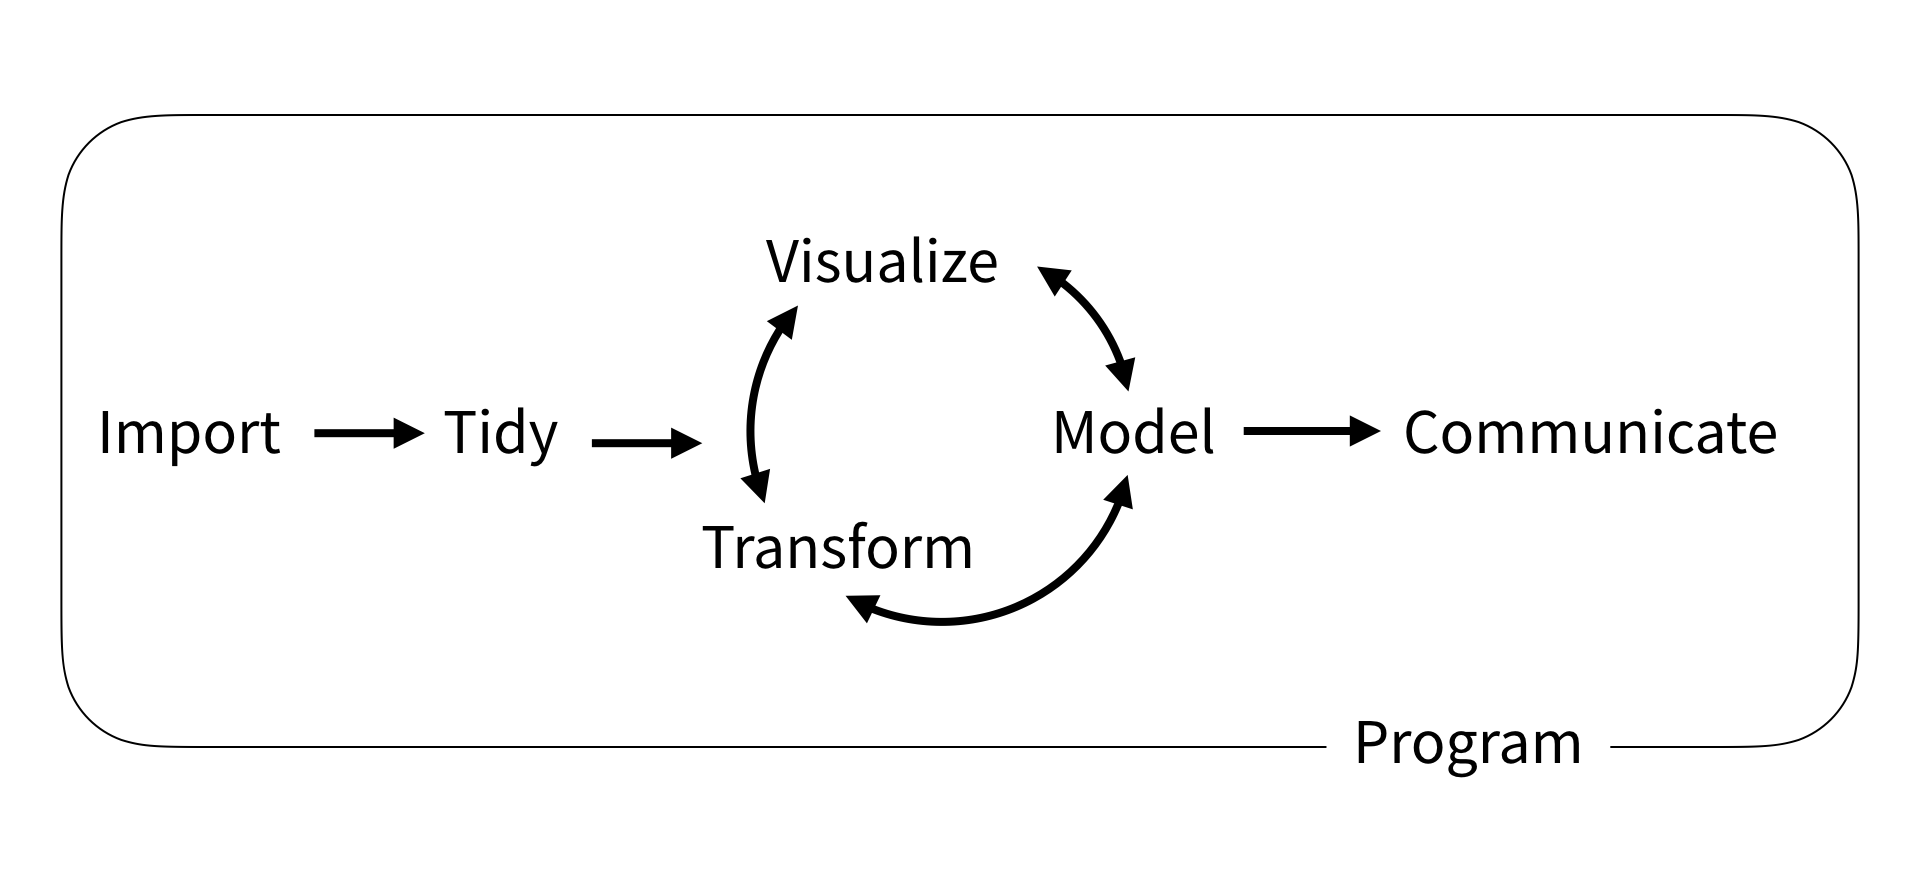
The data science workflow

What R can do?
- for fun
- for data
- for communication
R Markdown


- {rmarkdown} for assignments/reports/papers in
.htmland.pdf - {blogdown} for blogs
- {bookdown} for books
- {xaringan} for slides (220 slides!)
R Markdown documents are fully reproducible: weaving narrative text and code together.
What R can do?
- for fun
- for data
- for communication
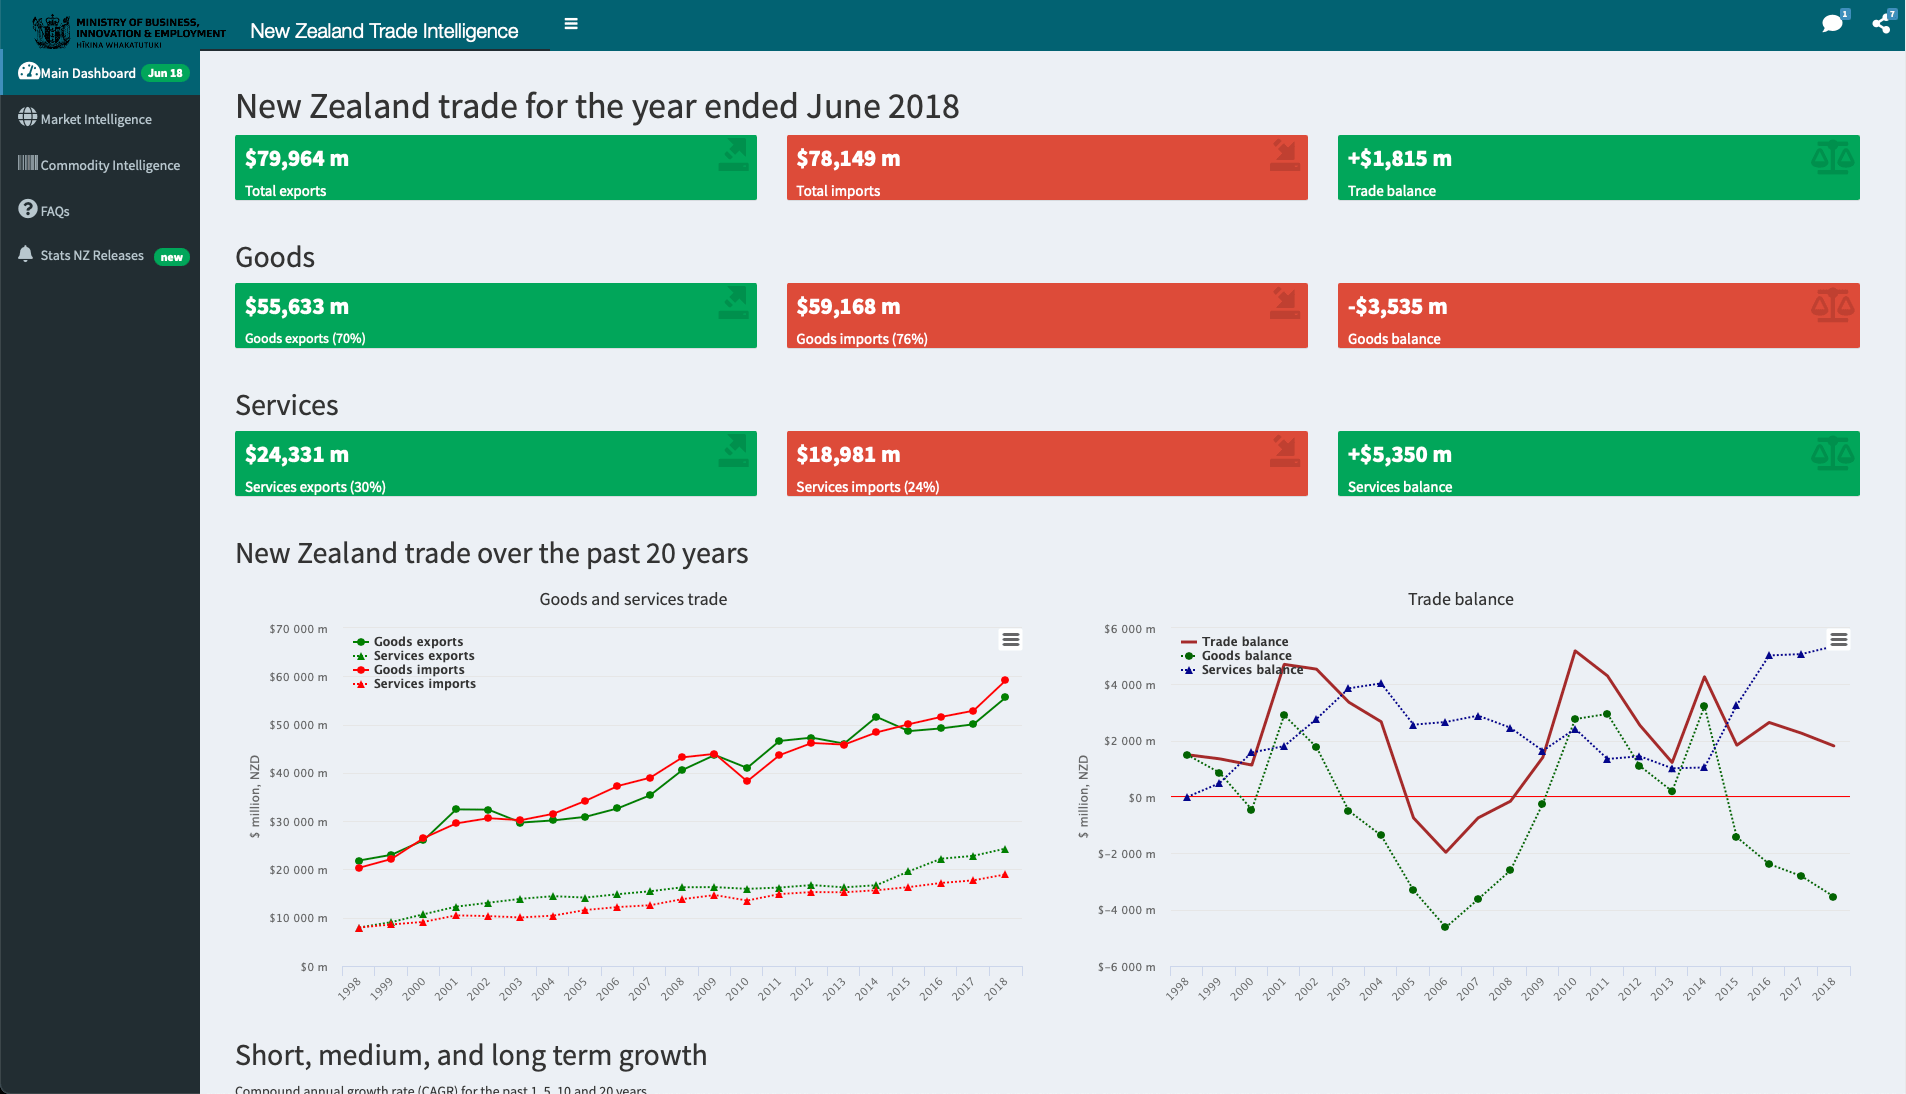
R shiny dashboard
- Shiny is an R package that makes it easy to build interactive web apps straight from R.
Textbook 📚
At first, you may be like this...

At first, you may be like this...
But you can do it!

![]()
If R were an airplane, RStudio would be the airport, providing many, many supporting services that make it easier for you, the pilot, to take off and go to awesome places. Sure, you can fly an airplane without an airport, but having those runways and supporting infrastructure is a game-changer.
-- Julie Lowndes
RStudio interface
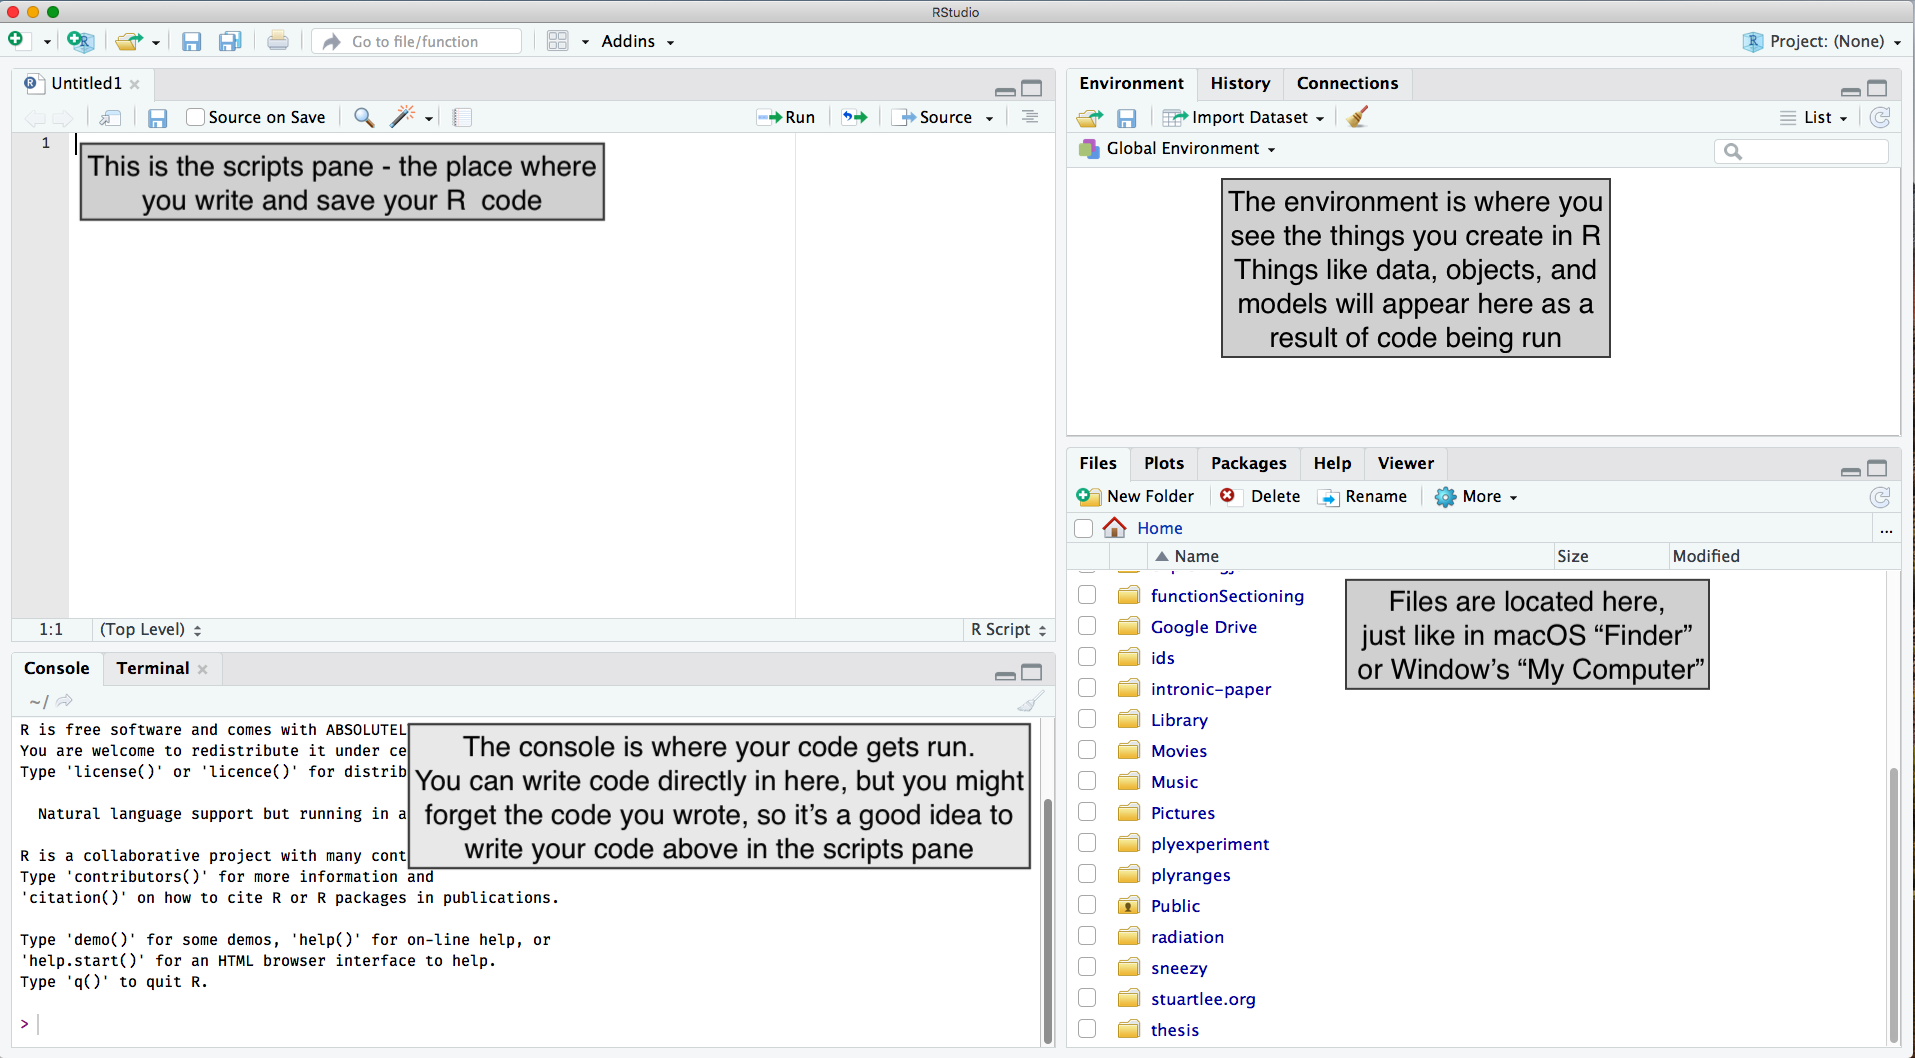
image credit: Stuart Lee
Setting up RStudio (do this once)
Go to Tools > Global Options:
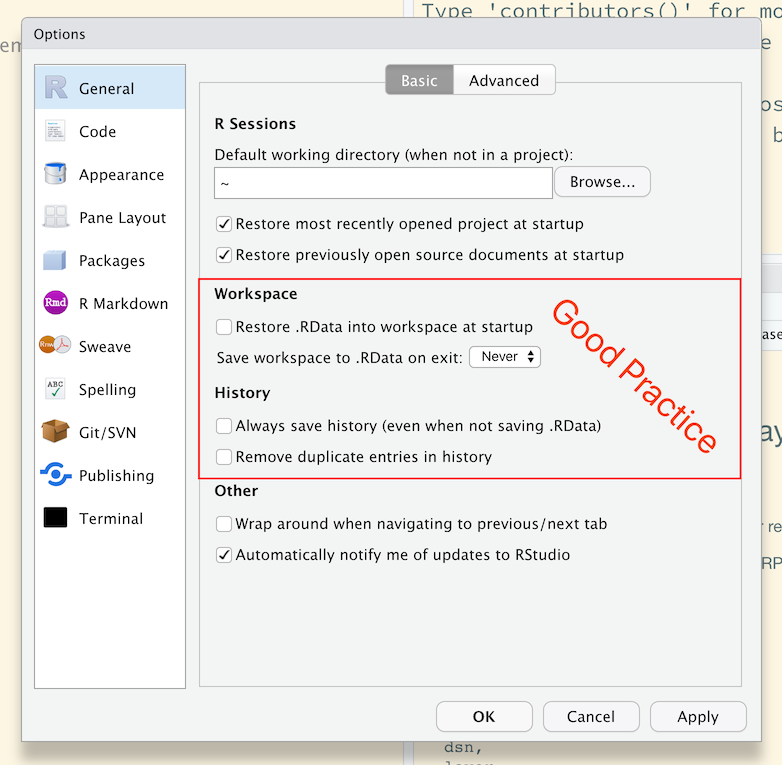
Uncheck Workspace and History, which helps to keep R working environment fresh and clean every time you switch between projects.
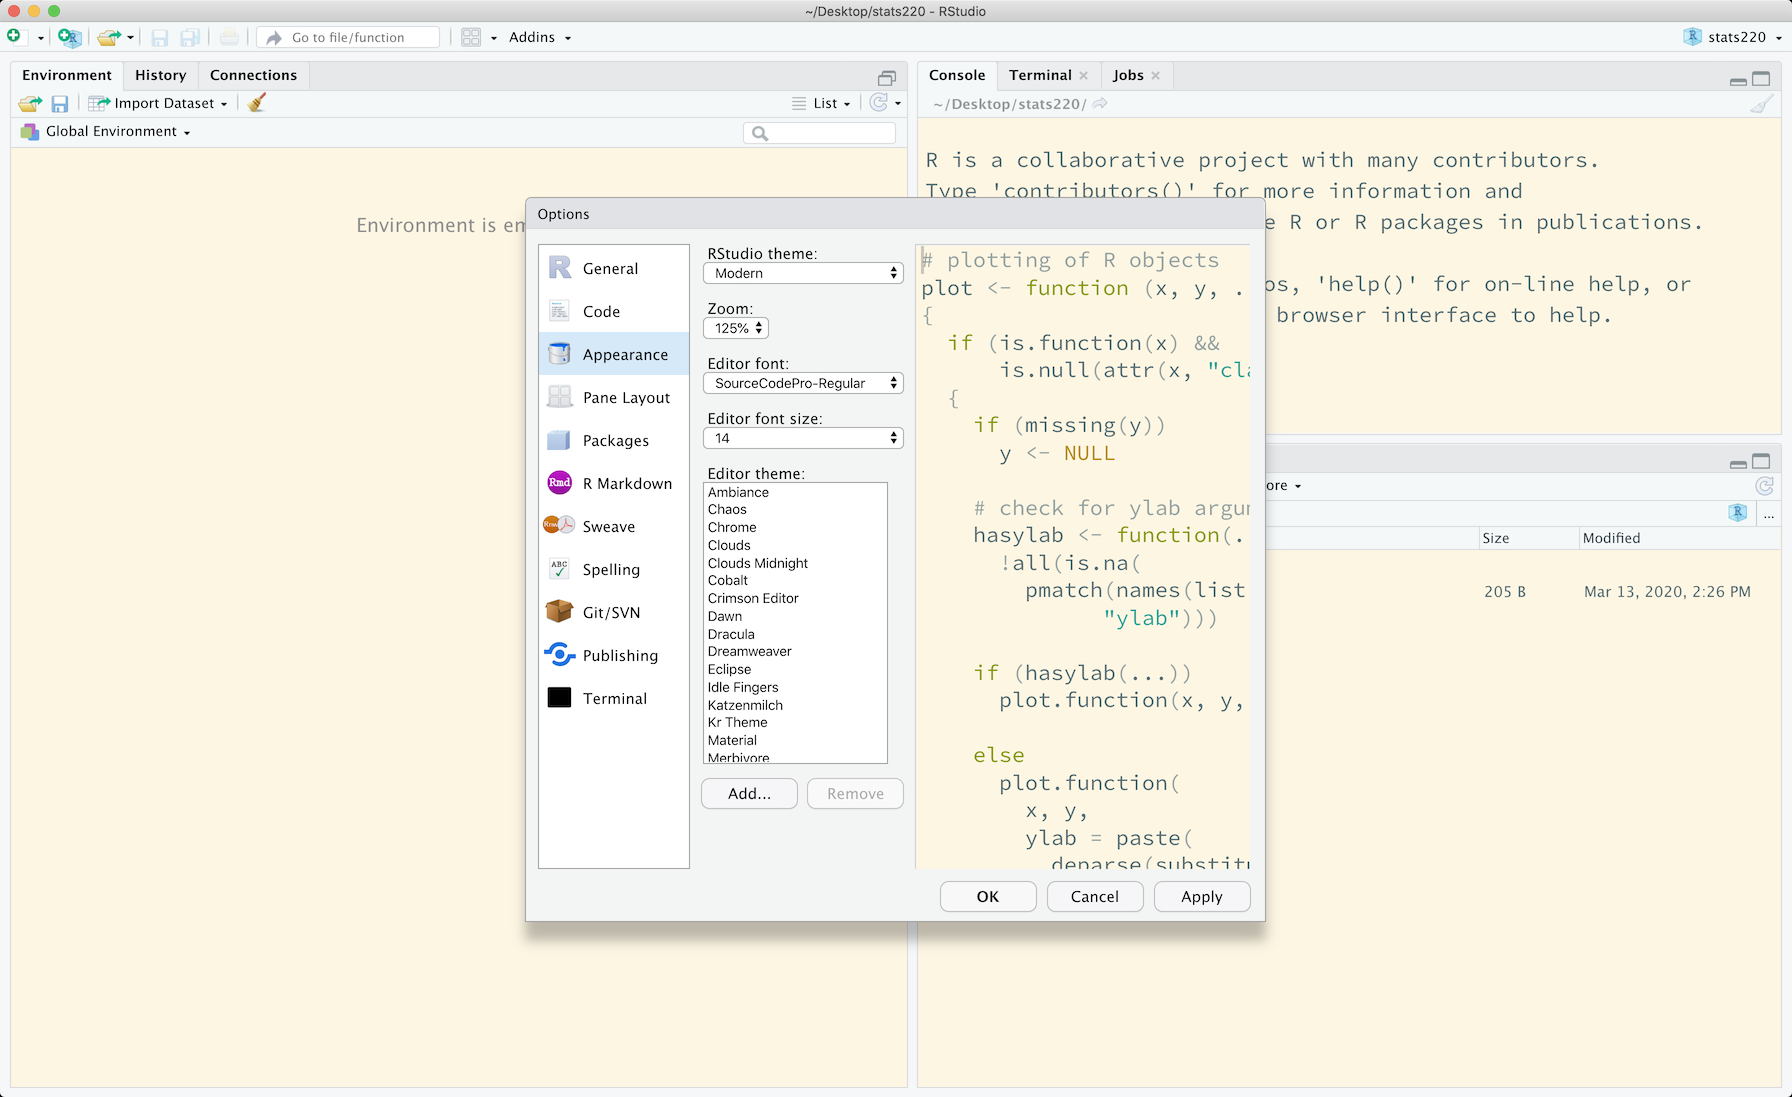
Your turn
Change the RStudio appearance up to your taste
01:00
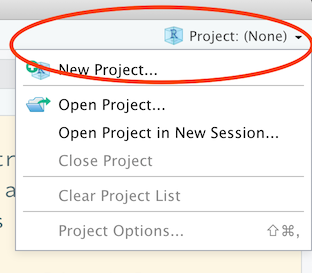
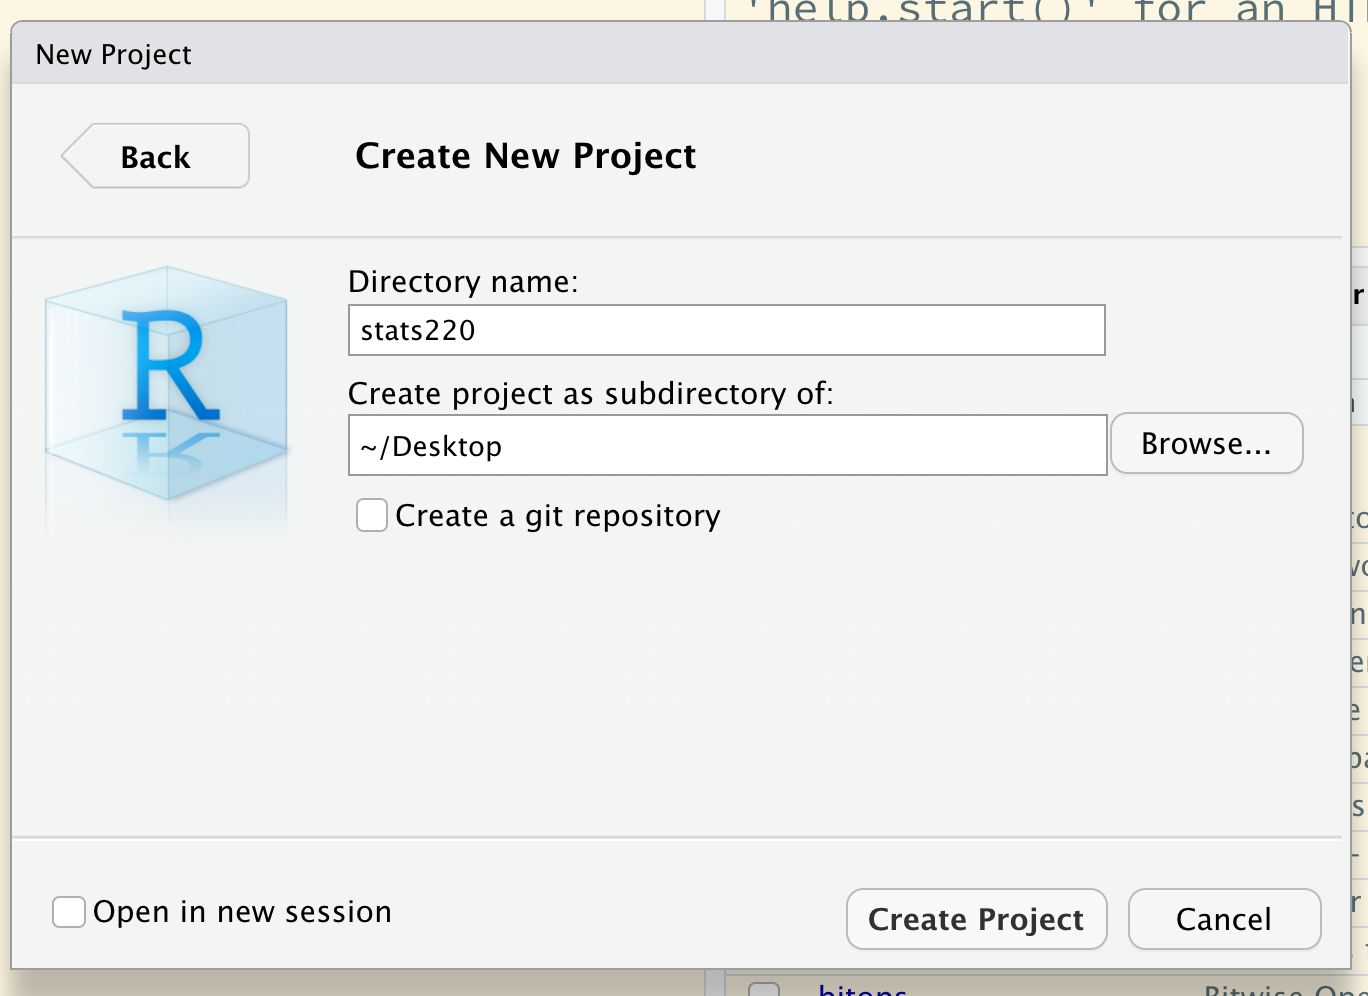
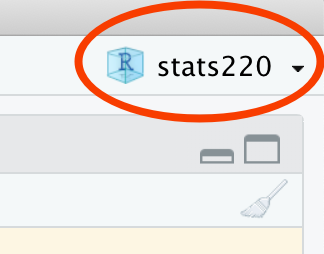
Create an RStudio project .Rproj
- Click the Project icon on the top right corner
- New Directory/Existing Directory > New Project > Create Project
- Open the project
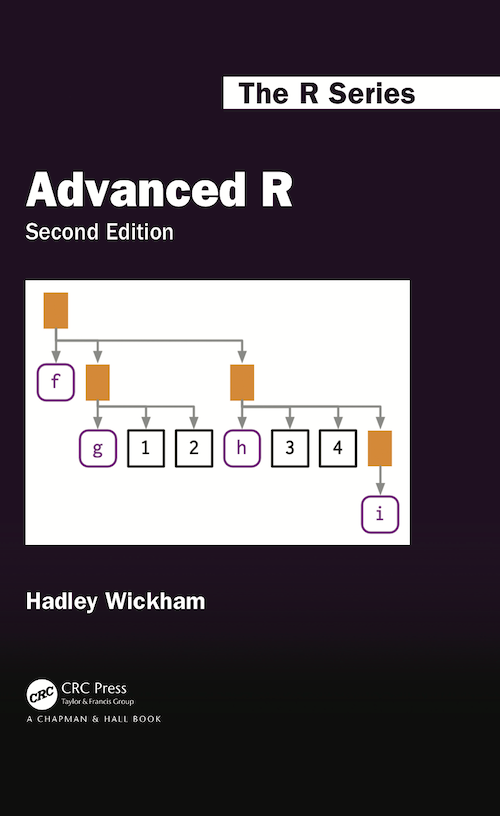
Atomic vectors
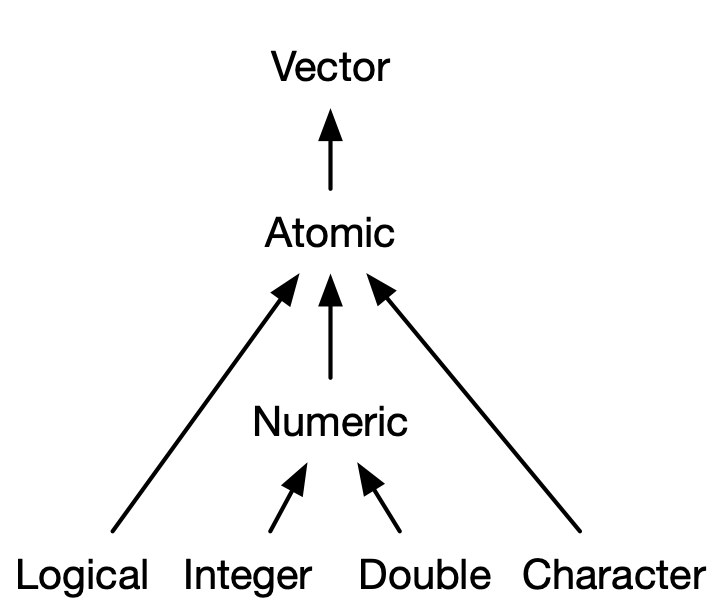
image credit: Hadley Wickham's Advanced R
Scalars: length of 1
- Logicals:
TRUEorFALSE - Doubles:
174.76,1.7476e2,Inf,-Inf,NaN(Not a Number) - Integers:
174L - Strings:
"hello",'world'
Vectors: values must all be the same type
lgl_vec <- c(TRUE, FALSE)int_vec <- c(174L, -36L)dbl_vec <- c(174.76, -36.85)chr_vec <- c("long", "lat")Atomic vectors
Use functions from packages
# install.packages("dplyr")library(dplyr)cummean(x)#> [1] 173.7600 174.7600 104.0567 68.9550first(x)#> [1] 173.76last(x)#> [1] -36.35

Follow the #rstats community
![]()