Lab 08
This lab exercise is due 23:59 Monday 17 May (NZST).
- You should submit an R Markdown file (i.e. file extension
.Rmd). - You should submit your Rmd file on Canvas.
- Late assignments are NOT accepted unless prior arrangement for medical/compassionate reasons.
In this lab exercise, you are going to practise reproducible reporting
using R Markdown for the communication purpose. The data set used is
akl-aqi19.csv that contains daily maximum AQIs recorded at Queen
Street in 2019.
Suppose that you have created an Rproj for this course. You need to
download akl-aqi19.csv
here
to data/ under your Rproj folder.
- NO marks will be given to the submission that cannot be reproduced on the hosted runner.
- The rendered report should be an HTML document. Marking is based on the rendered document, instead of the Rmd file.
- Use headings appropriately to split sections.
- Show and place all relevant source code, output, and narratives to the appropriate sections; otherwise, marks will be deducted.
- Set the figure’s size appropriately for clear presentation.
Marking scheme for each question
- Clean and readable code: 0.1 pts
- Correct output: 0.3 pts
- Sound explanations: 0.1 pts
R chunk for global setting
Include the following chunks straightly after the YAML header:
```{r setup, include = FALSE}
library(knitr)
opts_knit$set(root.dir = here::here())
opts_chunk$set(echo = TRUE, message = FALSE, warning = FALSE, fig.retina = 3,
  comment = "#>")
```

```{r prep}
library(tidyverse)
library(lubridate)
daily_aqi <- read_csv("data/akl-aqi19.csv")
aqi_cat <- fct_inorder(c("Good", "Moderate", "Unhealthy for Sensitive",
  "Unhealthy", "Very Unhealthy", "Hazardous"))
aqi_pal <- setNames(
  c("#00E400", "#FFFF00", "#FF7E00", "#FF0000", "#8F3F97", "#7E0023"),
  aqi_cat)
```
Data preparation
Add 3 new columns to daily_aqi:
aqi_cat: dividemax_aqiinto 6 categories:- 0 to 50: Good
- 51 to 100: Moderate
- 101 to 150: Unhealthy for Sensitive
- 151 to 200: Unhealthy
- 201 to 300: Very Unhealthy
- 301 and higher: Hazardous
month: extract month of the yearmday: extract day of the month
Print the newly created tibble.
#> # A tibble: 365 x 6
#>    date       location     max_aqi aqi_cat  month  mday
#>    <date>     <chr>          <dbl> <fct>    <ord> <int>
#>  1 2019-01-01 queen_street      36 Good     Jan       1
#>  2 2019-01-02 queen_street      30 Good     Jan       2
#>  3 2019-01-03 queen_street      35 Good     Jan       3
#>  4 2019-01-04 queen_street      41 Good     Jan       4
#>  5 2019-01-05 queen_street      54 Moderate Jan       5
#>  6 2019-01-06 queen_street      48 Good     Jan       6
#>  7 2019-01-07 queen_street      31 Good     Jan       7
#>  8 2019-01-08 queen_street      31 Good     Jan       8
#>  9 2019-01-09 queen_street      34 Good     Jan       9
#> 10 2019-01-10 queen_street      40 Good     Jan      10
#> # … with 355 more rows
Question 1 [0.5 pts]
- Present an HTML table that counts the number of days by months and AQI categories.
- Find out what happened in October when AQI reached to the “Very unhealthy” level, and provide a brief explanation in bold.
HINTS
- You need to use
group_by(.drop = FALSE)for keeping zeros.
| Month | Good | Moderate | Unhealthy for Sensitive | Unhealthy | Very Unhealthy | Hazardous |
|---|---|---|---|---|---|---|
| Jan | 26 | 5 | 0 | 0 | 0 | 0 |
| Feb | 25 | 3 | 0 | 0 | 0 | 0 |
| Mar | 22 | 9 | 0 | 0 | 0 | 0 |
| Apr | 24 | 6 | 0 | 0 | 0 | 0 |
| May | 20 | 11 | 0 | 0 | 0 | 0 |
| Jun | 13 | 17 | 0 | 0 | 0 | 0 |
| Jul | 13 | 18 | 0 | 0 | 0 | 0 |
| Aug | 11 | 20 | 0 | 0 | 0 | 0 |
| Sep | 15 | 15 | 0 | 0 | 0 | 0 |
| Oct | 14 | 15 | 0 | 0 | 2 | 0 |
| Nov | 11 | 19 | 0 | 0 | 0 | 0 |
| Dec | 20 | 11 | 0 | 0 | 0 | 0 |
Question 2 [0.5 pts]
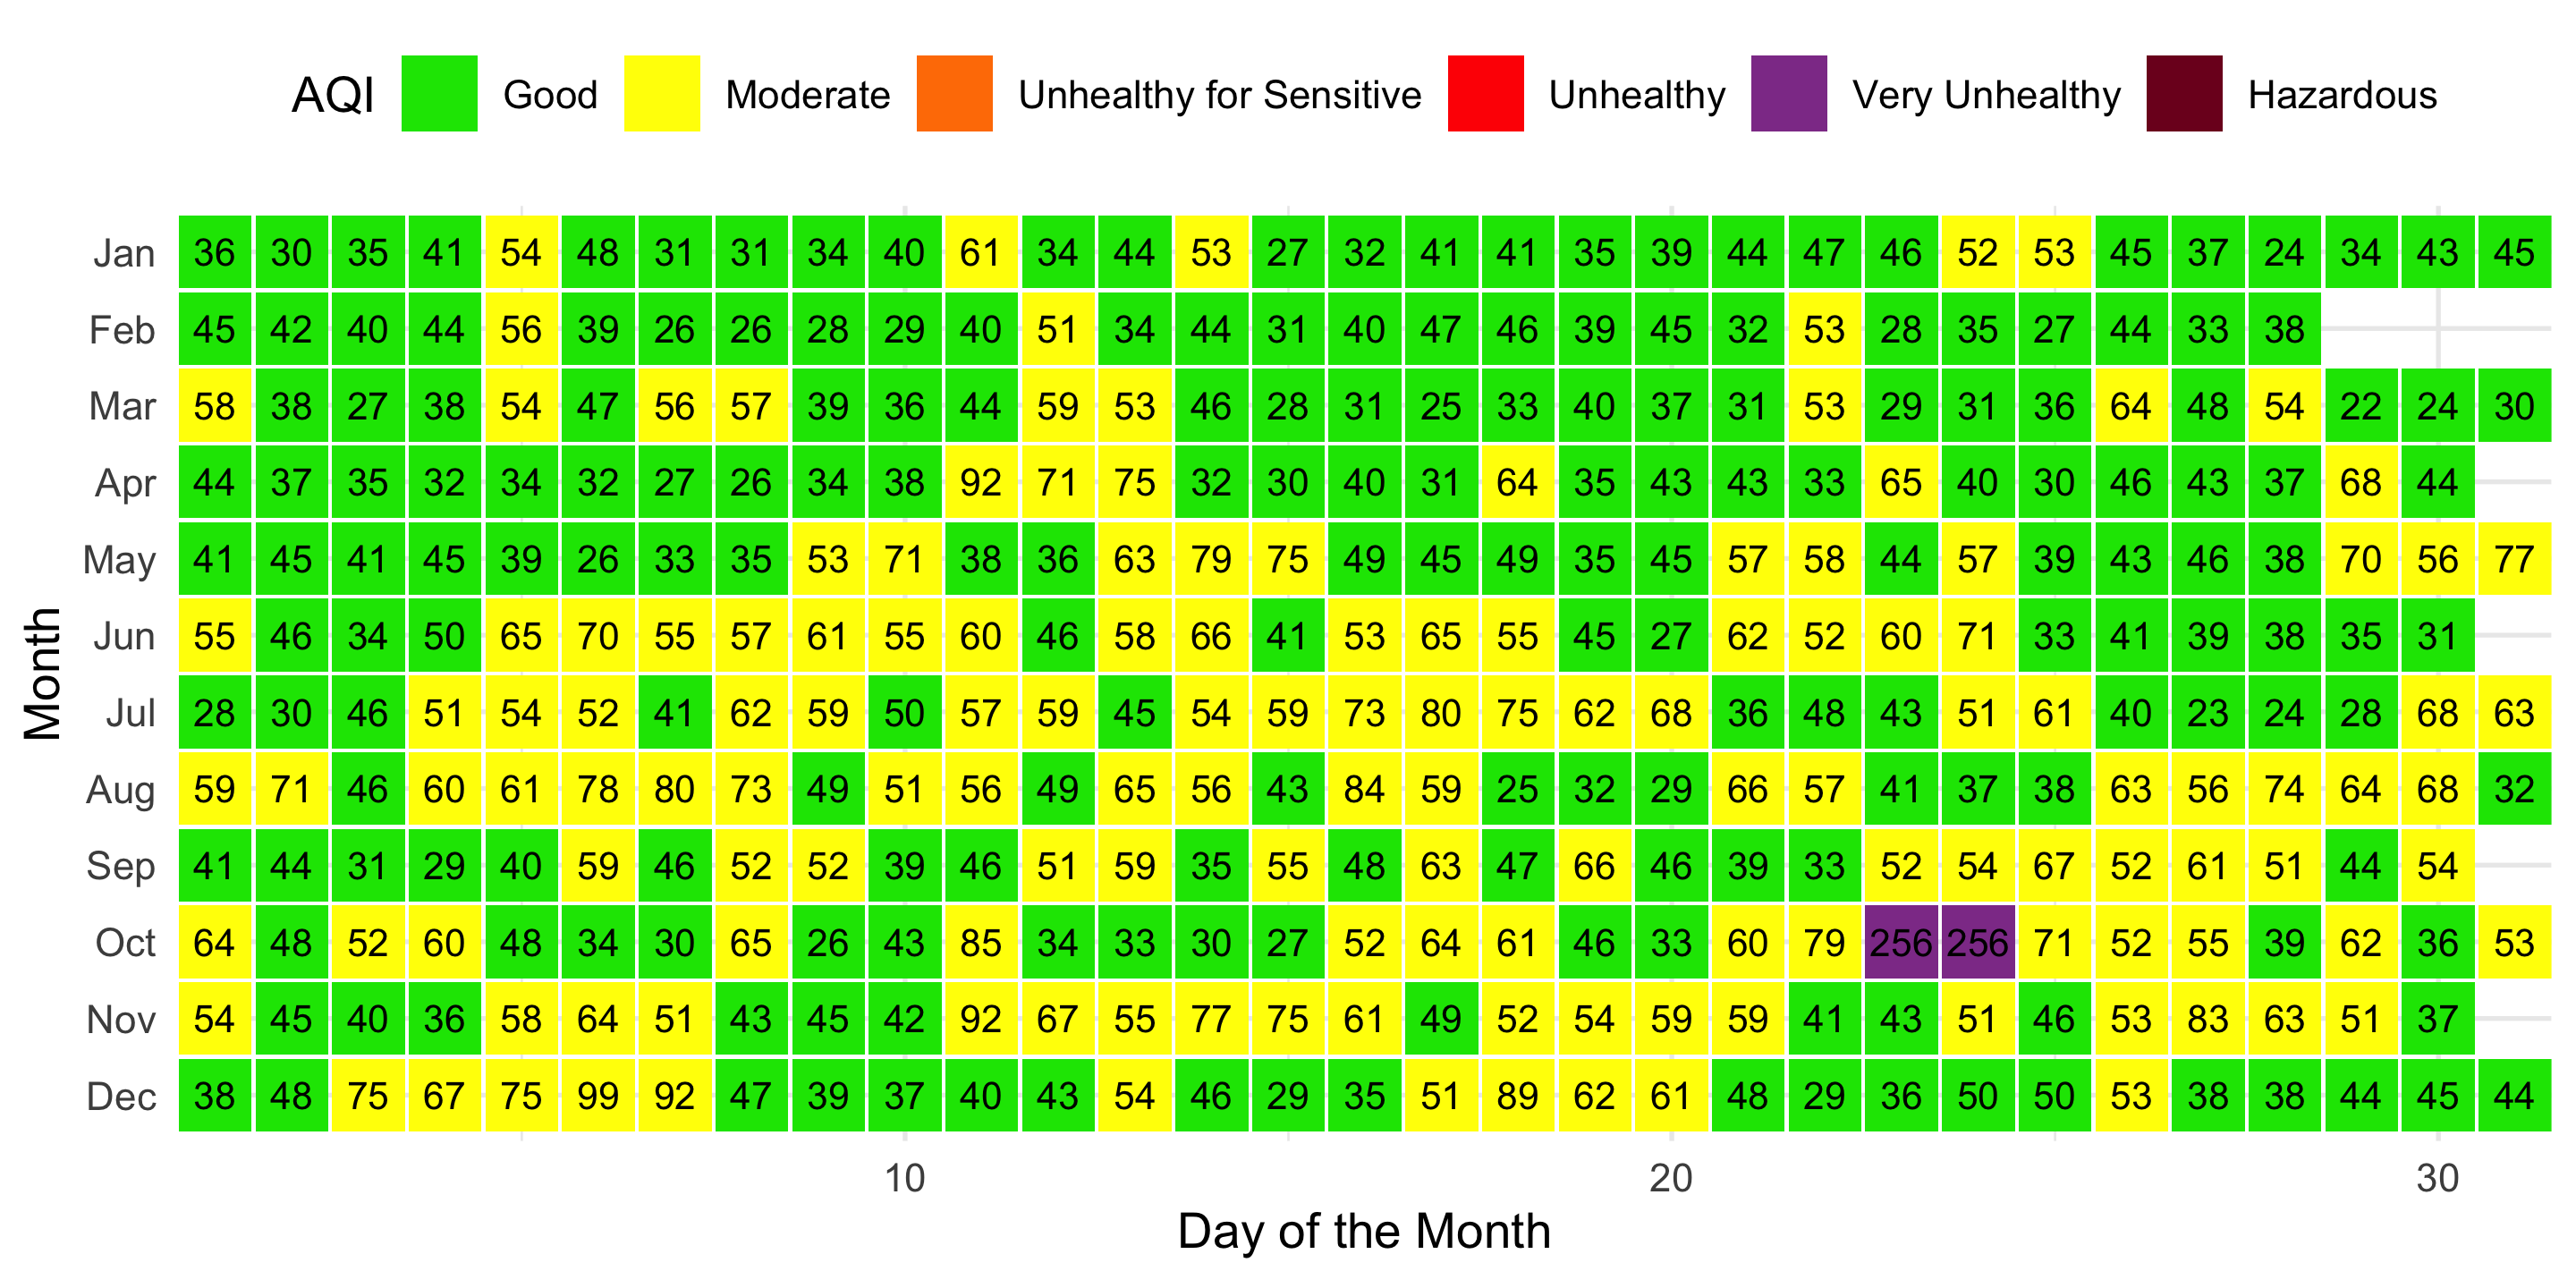
- Present a heatmap that gives an overview of AQI in Auckland over the year.
- Explain what primarily influenced the air quality in the second half of the year in bold.
NOTE:
- Each tile is a square, with
width&heightto be 0.95. - The text size for AQI values is 3.
- The legend on the top displays unused levels in one row.
- The colour scales match the AQI standard.
- The default expansion around the data plot is disabled.
HINTS
- You need to use
expand = expansion()inscale_*()to disable expansion.