Assignment 3
This assignment is due 23:59 Friday 28 May (NZST).
- You should submit an R Markdown file (i.e. file extension
.Rmd). - You should submit your Rmd file on Canvas.
- Late assignments are NOT accepted unless prior arrangement for medical/compassionate reasons.
- Your submission should NOT contain any plagiarism.
In this assignment, you will present your findings about 2018 Citi Bike
trip data in New York City (2018-citibike-tripdata.csv).
Suppose that you have created an Rproj for this course. You need to
download 2018-citibike-tripdata.csv
here
to data/ under your Rproj folder.
- You should use the Rmd template provided. Download the template
and save it to your
Rprojfolder. If you fail to compile the Rmd due to some missing packages, install these packages on your computer. - NO marks will be given to the submission that cannot be reproduced on the hosted runner.
- Marking is based on the rendered document, instead of the Rmd file.
- Show and place all relevant source code, output, and narratives to the appropriate sections; otherwise, marks will be deducted.
- Set each figure’s size appropriately for clear presentation.
- If you use other sources of data to enrich the exploration, please
fill the Google
form
and upload your data. Make sure that all data files are placed under
the
data/folder.
Citi NYC offical website
Q1: Web scraping [3 pts]
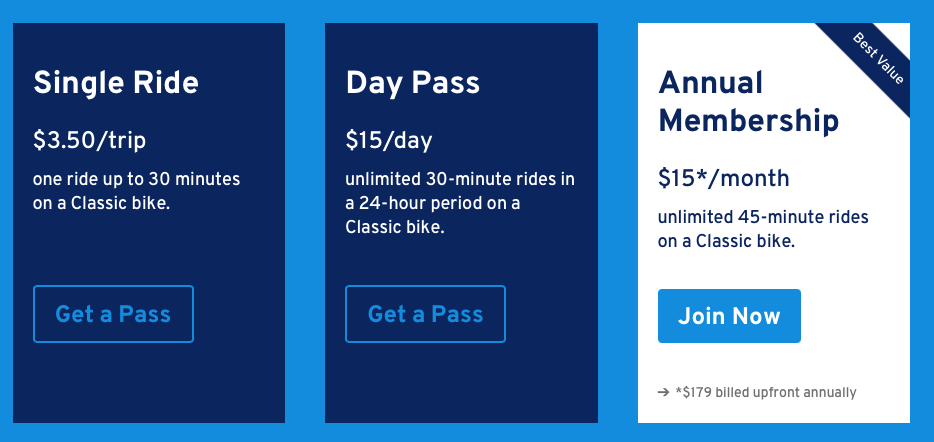
Scrape Citi bike membership plan from this web page, and present the scraped data as an HTML table.
| Plan | Price | Minutes |
|---|---|---|
| Single Ride | $3.50/trip | one ride up to 30 minutes on a Classic bike. |
| Day Pass | $15/day | unlimited 30-minute rides in a 24-hour period on a Classic bike. |
| Annual Membership | $15*/month | unlimited 45-minute rides on a Classic bike. |
Q2: Critique [1 pts]
Your instructor deliberately introduced a decision mistake to Assignment 2 Question 4. This decision didn’t do any harm to the analysis, but it could certainly be improved to better fit the context by more adequate research about the Citi bike data. Point out what the issue is, and provide reference to support your argument. (NOTE: NO marks given for pointing out the issue alone without any reference.)
Q3: Polishing [1 pts]
Pick one plot (or its variants) from Assignment 2, and make improvements to get a polished one for the purpose of communication. For example,
- add informative titles and labels
- apply appropriate scales if needed
- use colour-blind friendly colours if needed
- highlight something of interest, etc.
Q4: Exploration [5 pts]
-
Create at least one publication-ready plot that have NOT been seen in Assignment 1 and 2, in the meantime reveal some new insights (i.e. interesting and meaningful) about the data. Provide a description of:
- what question you had in mind motivated this plot;
- what you found interesting from this plot.
- You might want to briefly mention some of the dead ends you went down to demonstrate that you have done more than just the obvious. Provide your code in the “Appendix” section.
-
Summarise what you learned from this data in general. Try and weave your findings together into a consistent story.
-
Reflect on other questions that the exploration raised, and what you would do next in terms of further questions or ways to investigate the data.
NOTE:
- Interactive graphics are NOT accepted.
- DO NOT share any of your ideas or explorations on Piazza or other venues.
Grading rubric: