Lab 03 Solution
This lab exercise is due 23:59 Monday 29 March (NZDT).
- You should submit an R file (i.e. file extension
.R) containing R code that assigns the appropriate values to the appropriate symbols. - Your R file will be executed in order and checked against the values that have been assigned to the symbols using an automatic grading system. Marks will be fully deducted for non-identical results.
- Intermediate steps to achieve the final results will NOT be checked.
- Each question is worth 0.2 points.
- You should submit your R file on Canvas.
- Late assignments are NOT accepted unless prior arrangement for medical/compassionate reasons.
In this lab exercise, you are going to work with a data set: villagers
for Animal Crossing - New Horizons as in villagers.csv. You shall use
the following code to start with this lab session:
library(tidyverse)
villagers <- read_csv("data/animal-crossing/villagers.csv")
villagers
#> # A tibble: 391 x 11
#>    row_n id     name  gender species birthday personality song  phrase
#>    <dbl> <chr>  <chr> <chr>  <chr>   <chr>    <chr>       <chr> <chr>
#>  1     2 admir… Admi… male   bird    1-27     cranky      Stee… aye a…
#>  2     3 agent… Agen… female squirr… 7-2      peppy       DJ K… sidek…
#>  3     4 agnes  Agnes female pig     4-21     uchi        K.K.… snuff…
#>  4     6 al     Al    male   gorilla 10-18    lazy        Stee… Ayyee…
#>  5     7 alfon… Alfo… male   alliga… 6-9      lazy        Fore… it'sa…
#>  6     8 alice  Alice female koala   8-19     normal      Surf… guvnor
#>  7     9 alli   Alli  female alliga… 11-8     snooty      K.K.… graaa…
#>  8    10 amelia Amel… female eagle   11-19    snooty      K.K.… eaglet
#>  9    11 anabe… Anab… female anteat… 2-16     peppy       Aloh… snorty
#> 10    13 ancho… Anch… male   bird    3-4      lazy        K.K.… chuurp
#> # … with 381 more rows, and 2 more variables: full_id <chr>,
#> #   url <chr>
- Make sure to include the snippet above upfront in your R file.
Suppose that you have created an Rproj for this course. You need to
download villagers.csv
here
(right click, select “Save link as”/“Download Linked File As”) to
data/animal-crossing/ under your Rproj folder.
- You’re required to use relative file paths
data/animal-crossing/villagers.csvto import the data. - NO marks will be given for using URL links or different file paths.
- DO NOT include
install.packages()in your R file. - DO NOT print any R objects and plots.
You should use the villagers data for all questions.
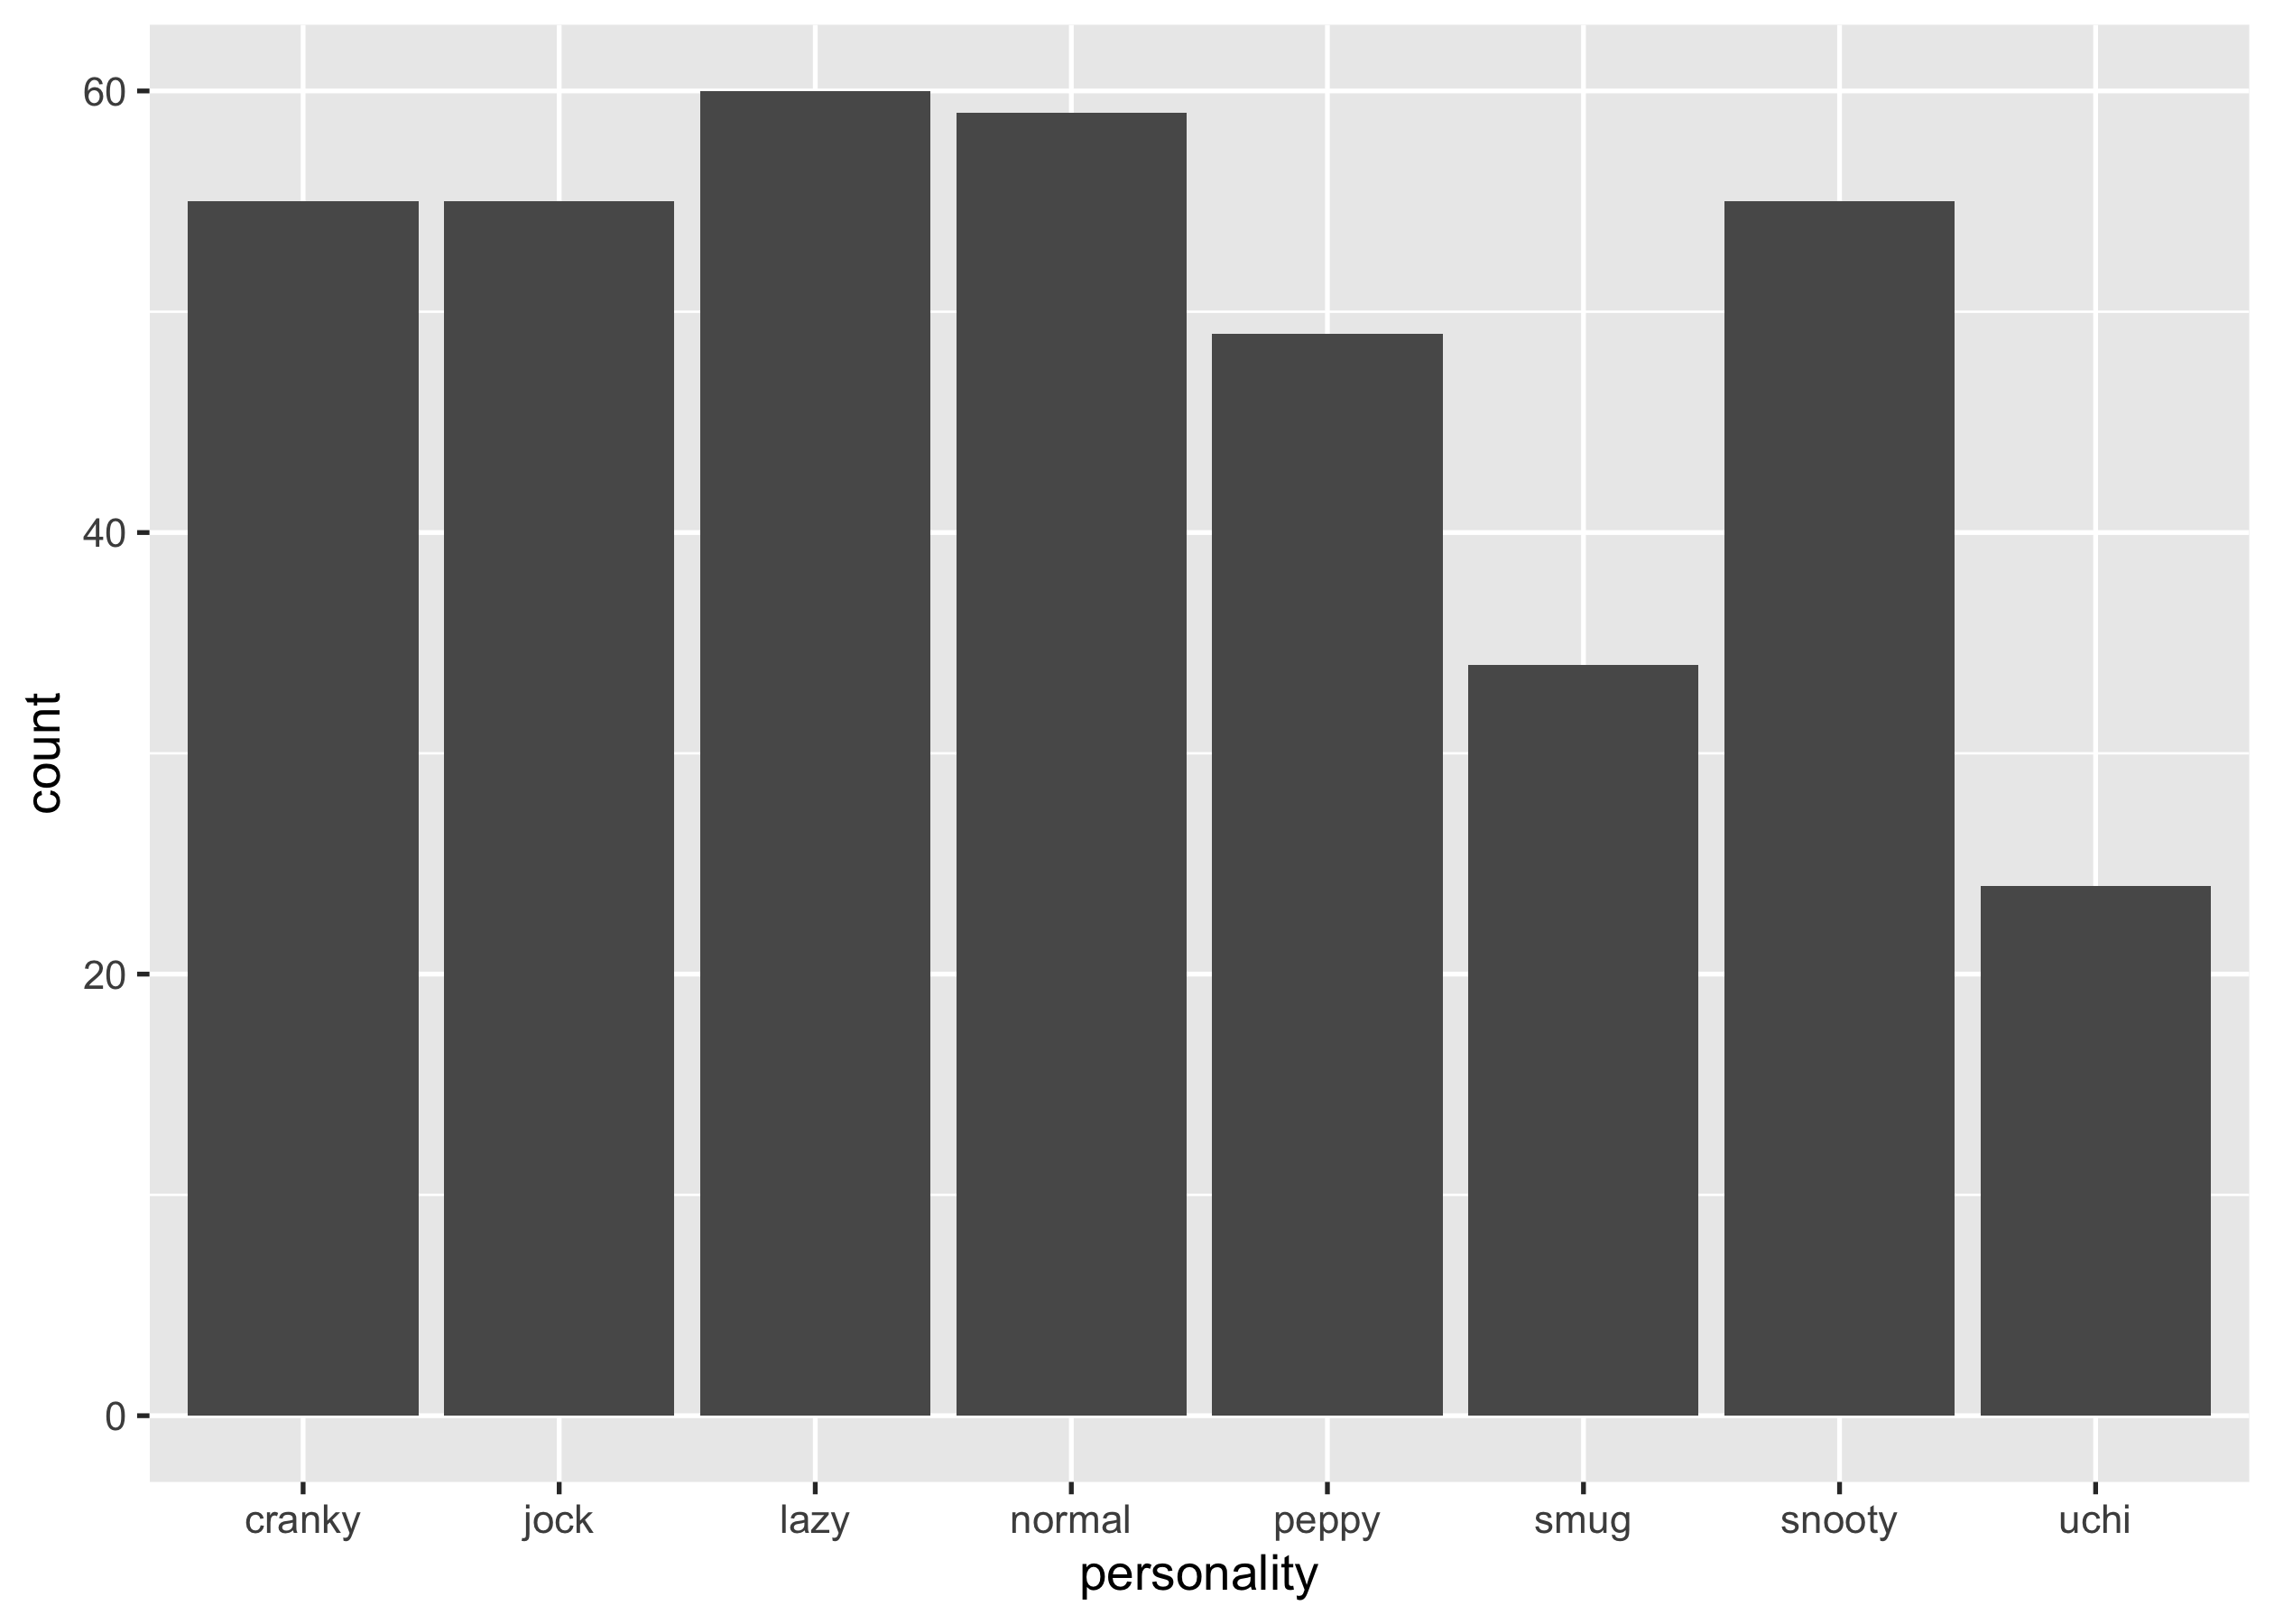
Question 1
Write {ggplot2} code to generate a bar chart that displays the counts of
different personalities (personality). You should end up with a
ggplot called p1.
p1 <- ggplot(villagers, aes(x = personality)) +
  geom_bar()
p1
Question 2
Write {ggplot2} code to generate a bar chart that displays the counts of
different personalities (personality), with colour filled by gender.
You should end up with a ggplot called p2.
p2 <- ggplot(villagers, aes(x = personality, fill = gender)) +
  geom_bar()
p2

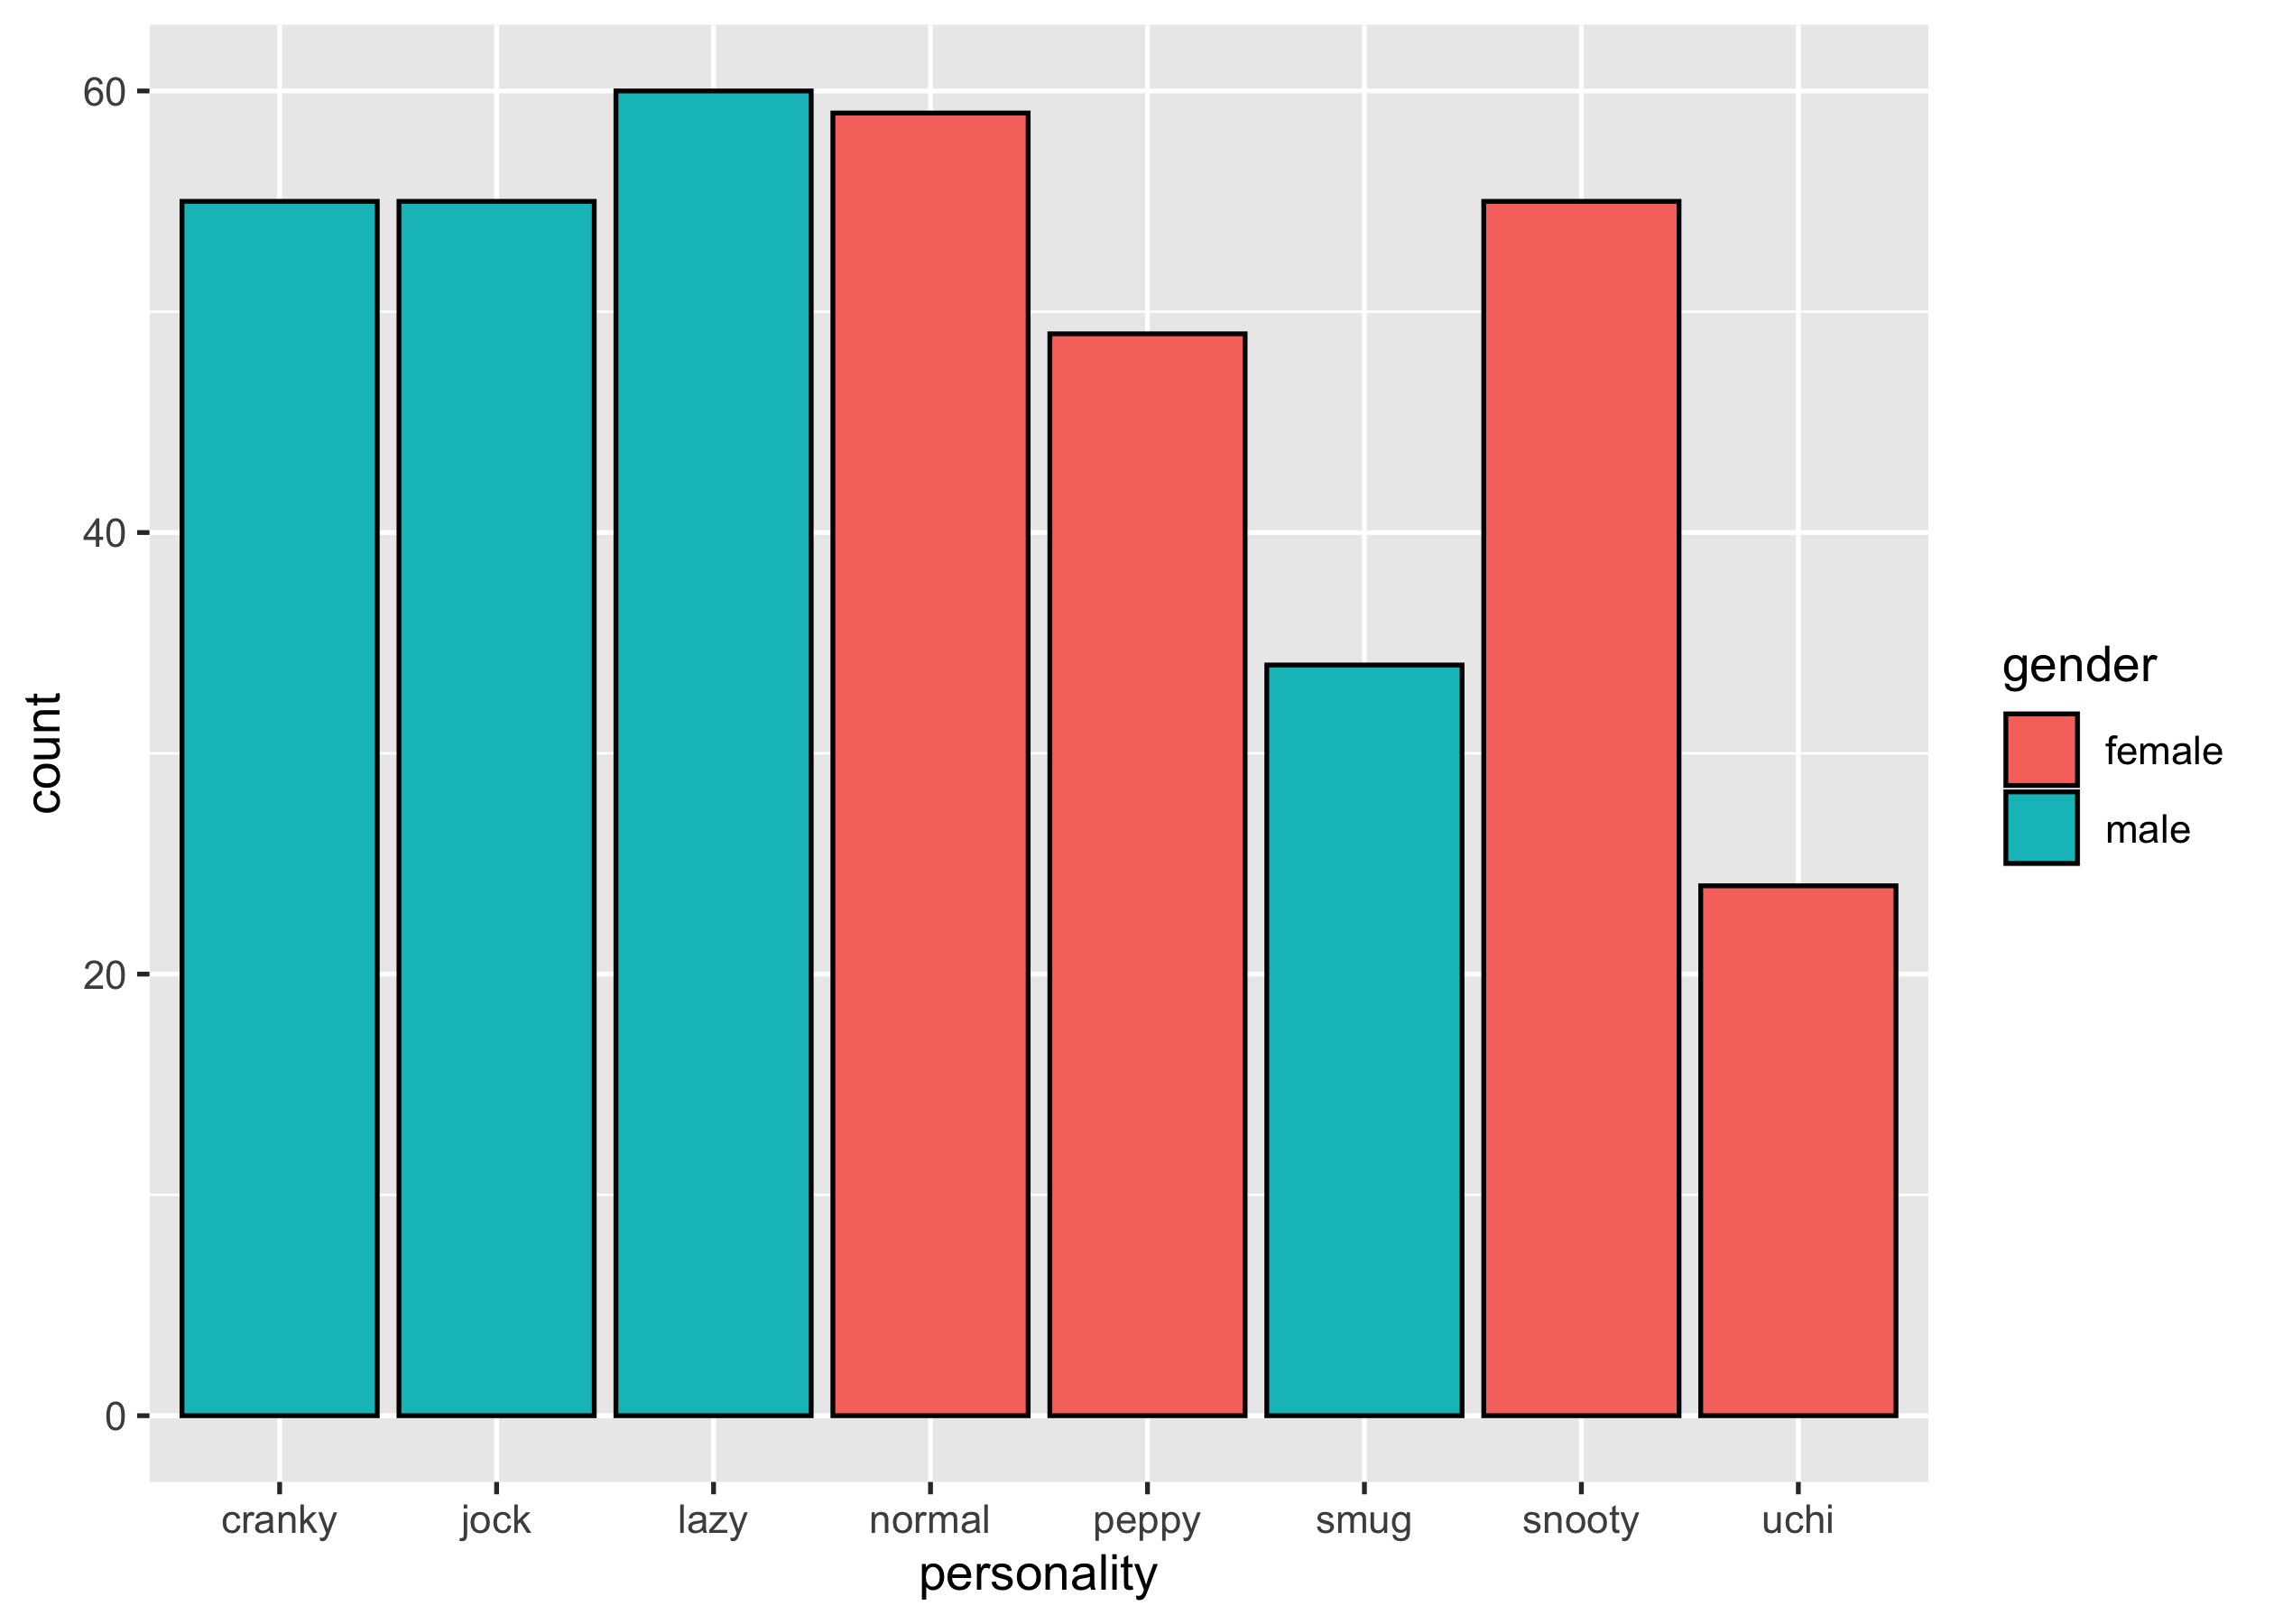
Question 3
Write {ggplot2} code to generate a bar chart that displays the counts of
different personalities (personality), with colour filled by gender,
and border colour set to "black". You should end up with a ggplot
called p3.
p3 <- ggplot(villagers, aes(x = personality, fill = gender)) +
  geom_bar(colour = "black")
p3
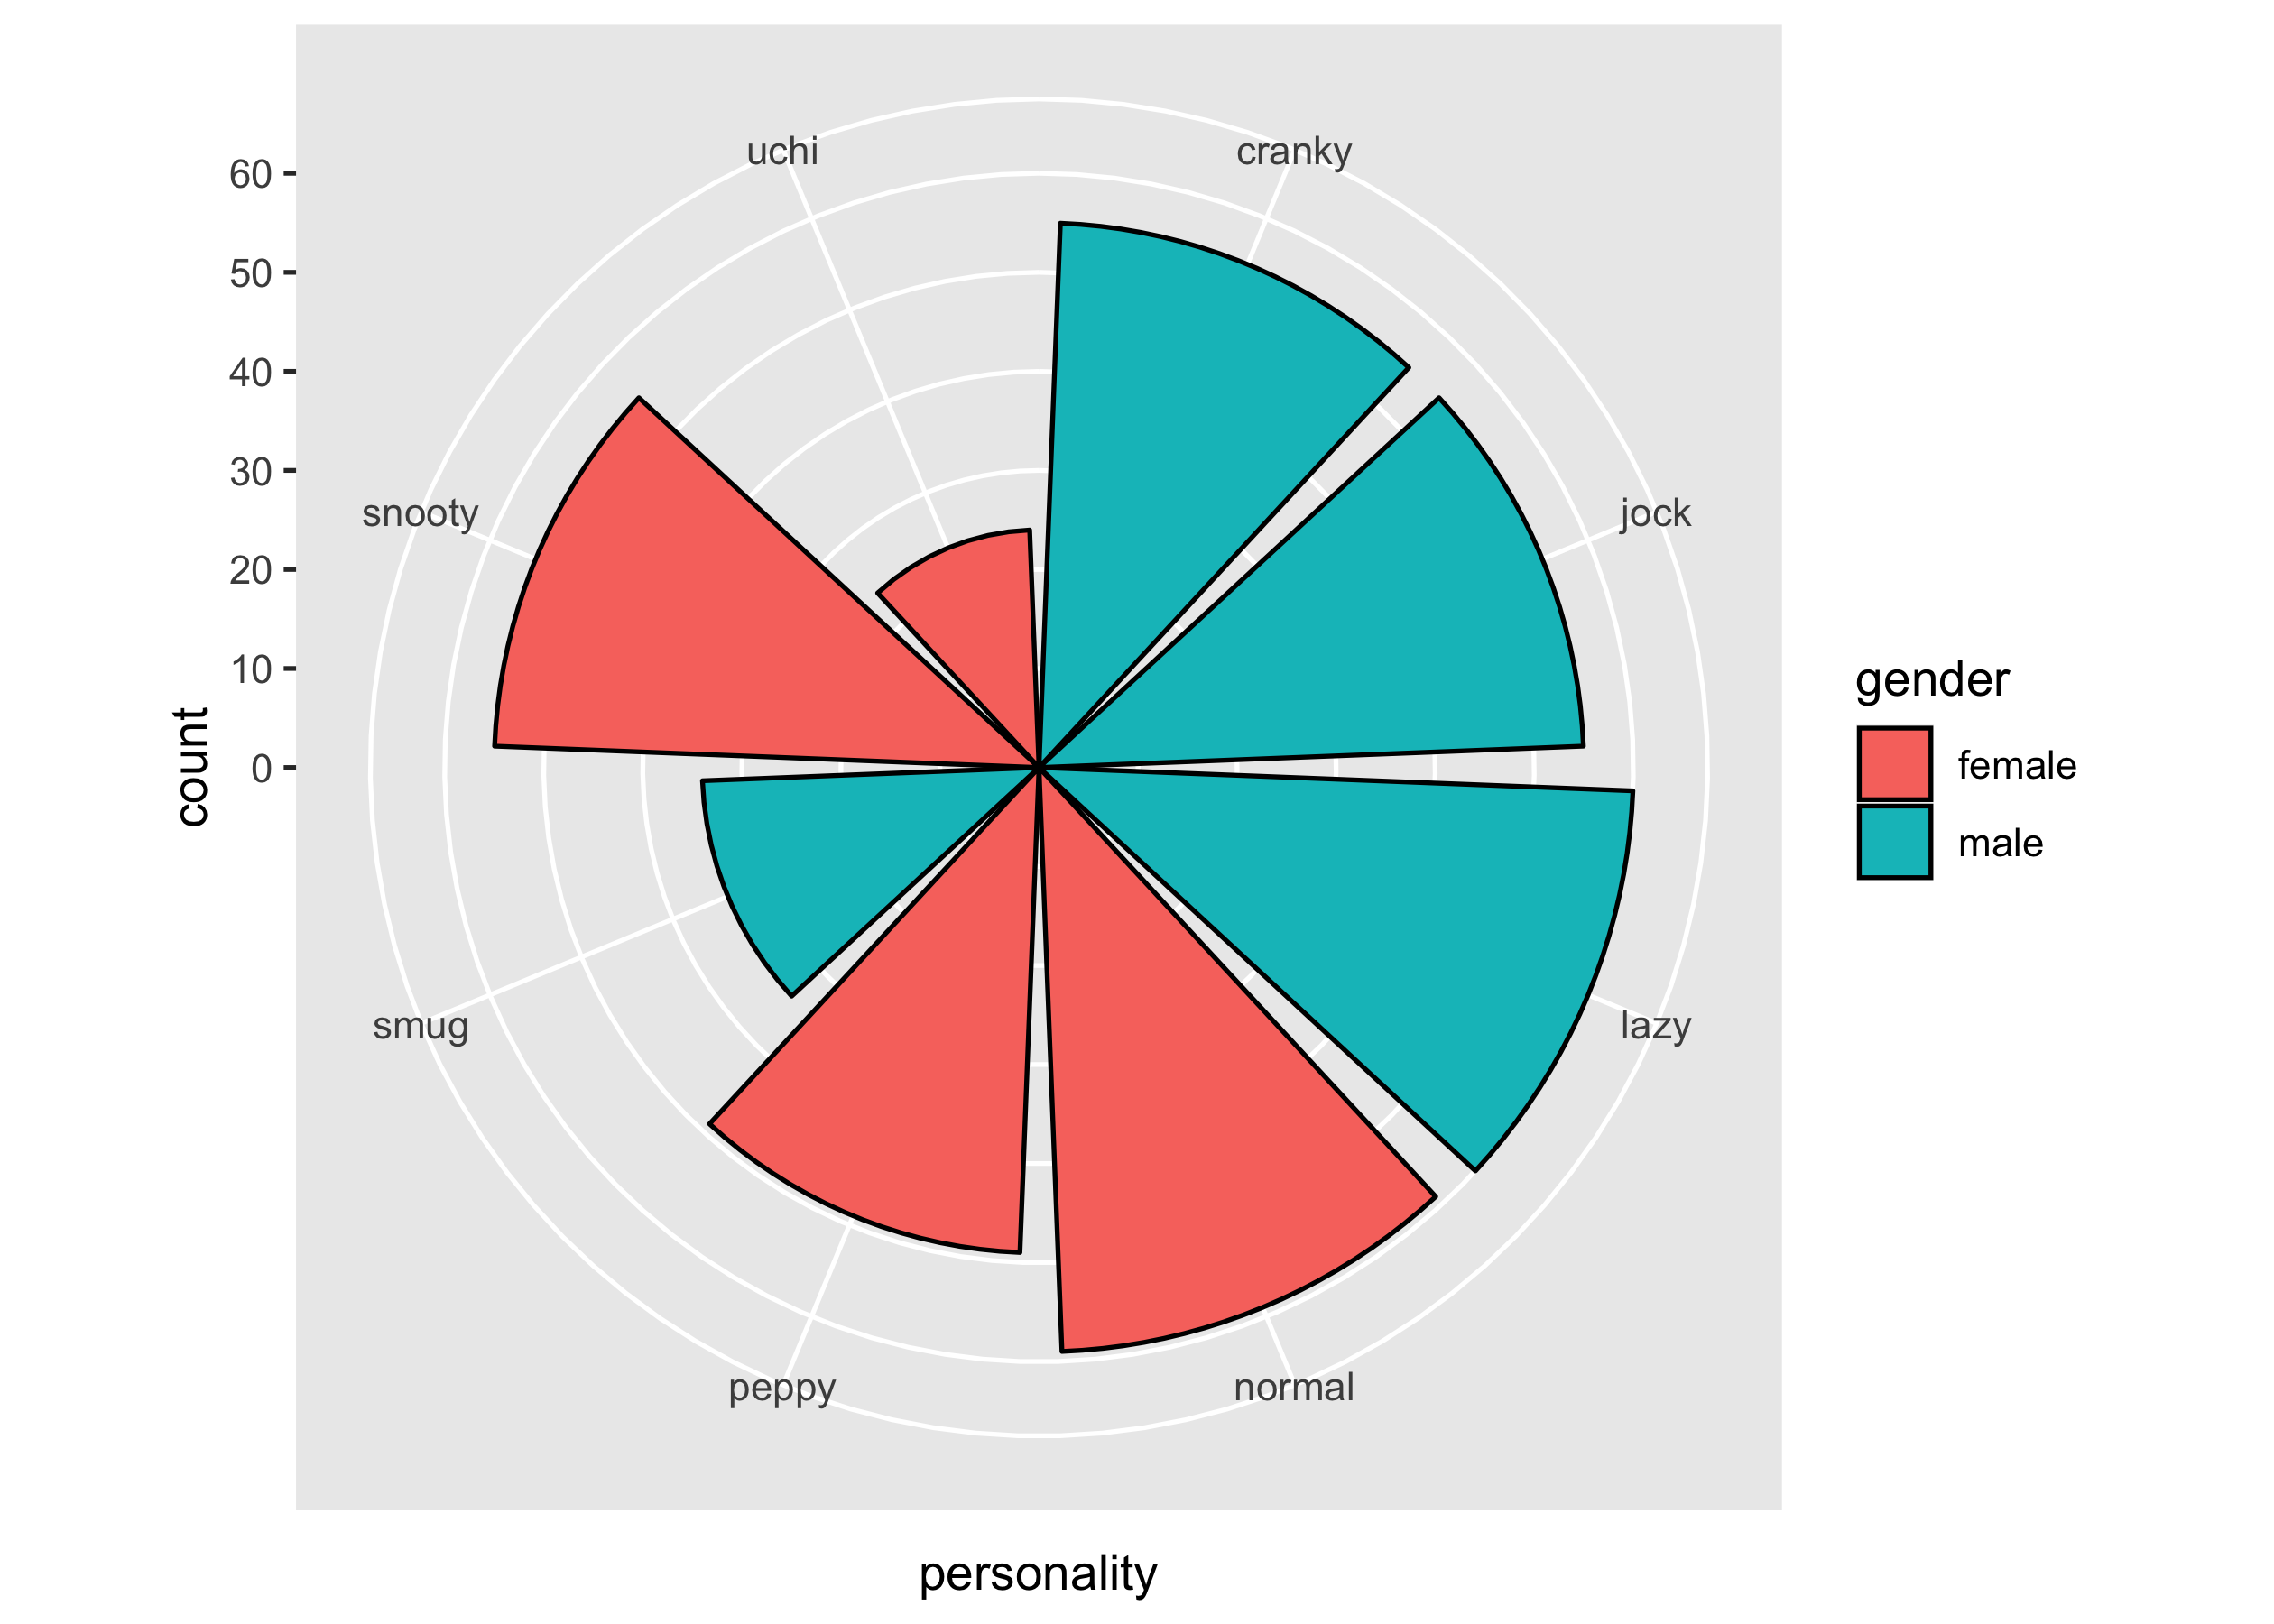
Question 4
Display p3 on polar coordinates. You should end up with a ggplot
called p4.
p4 <- p3 +
  coord_polar()
p4
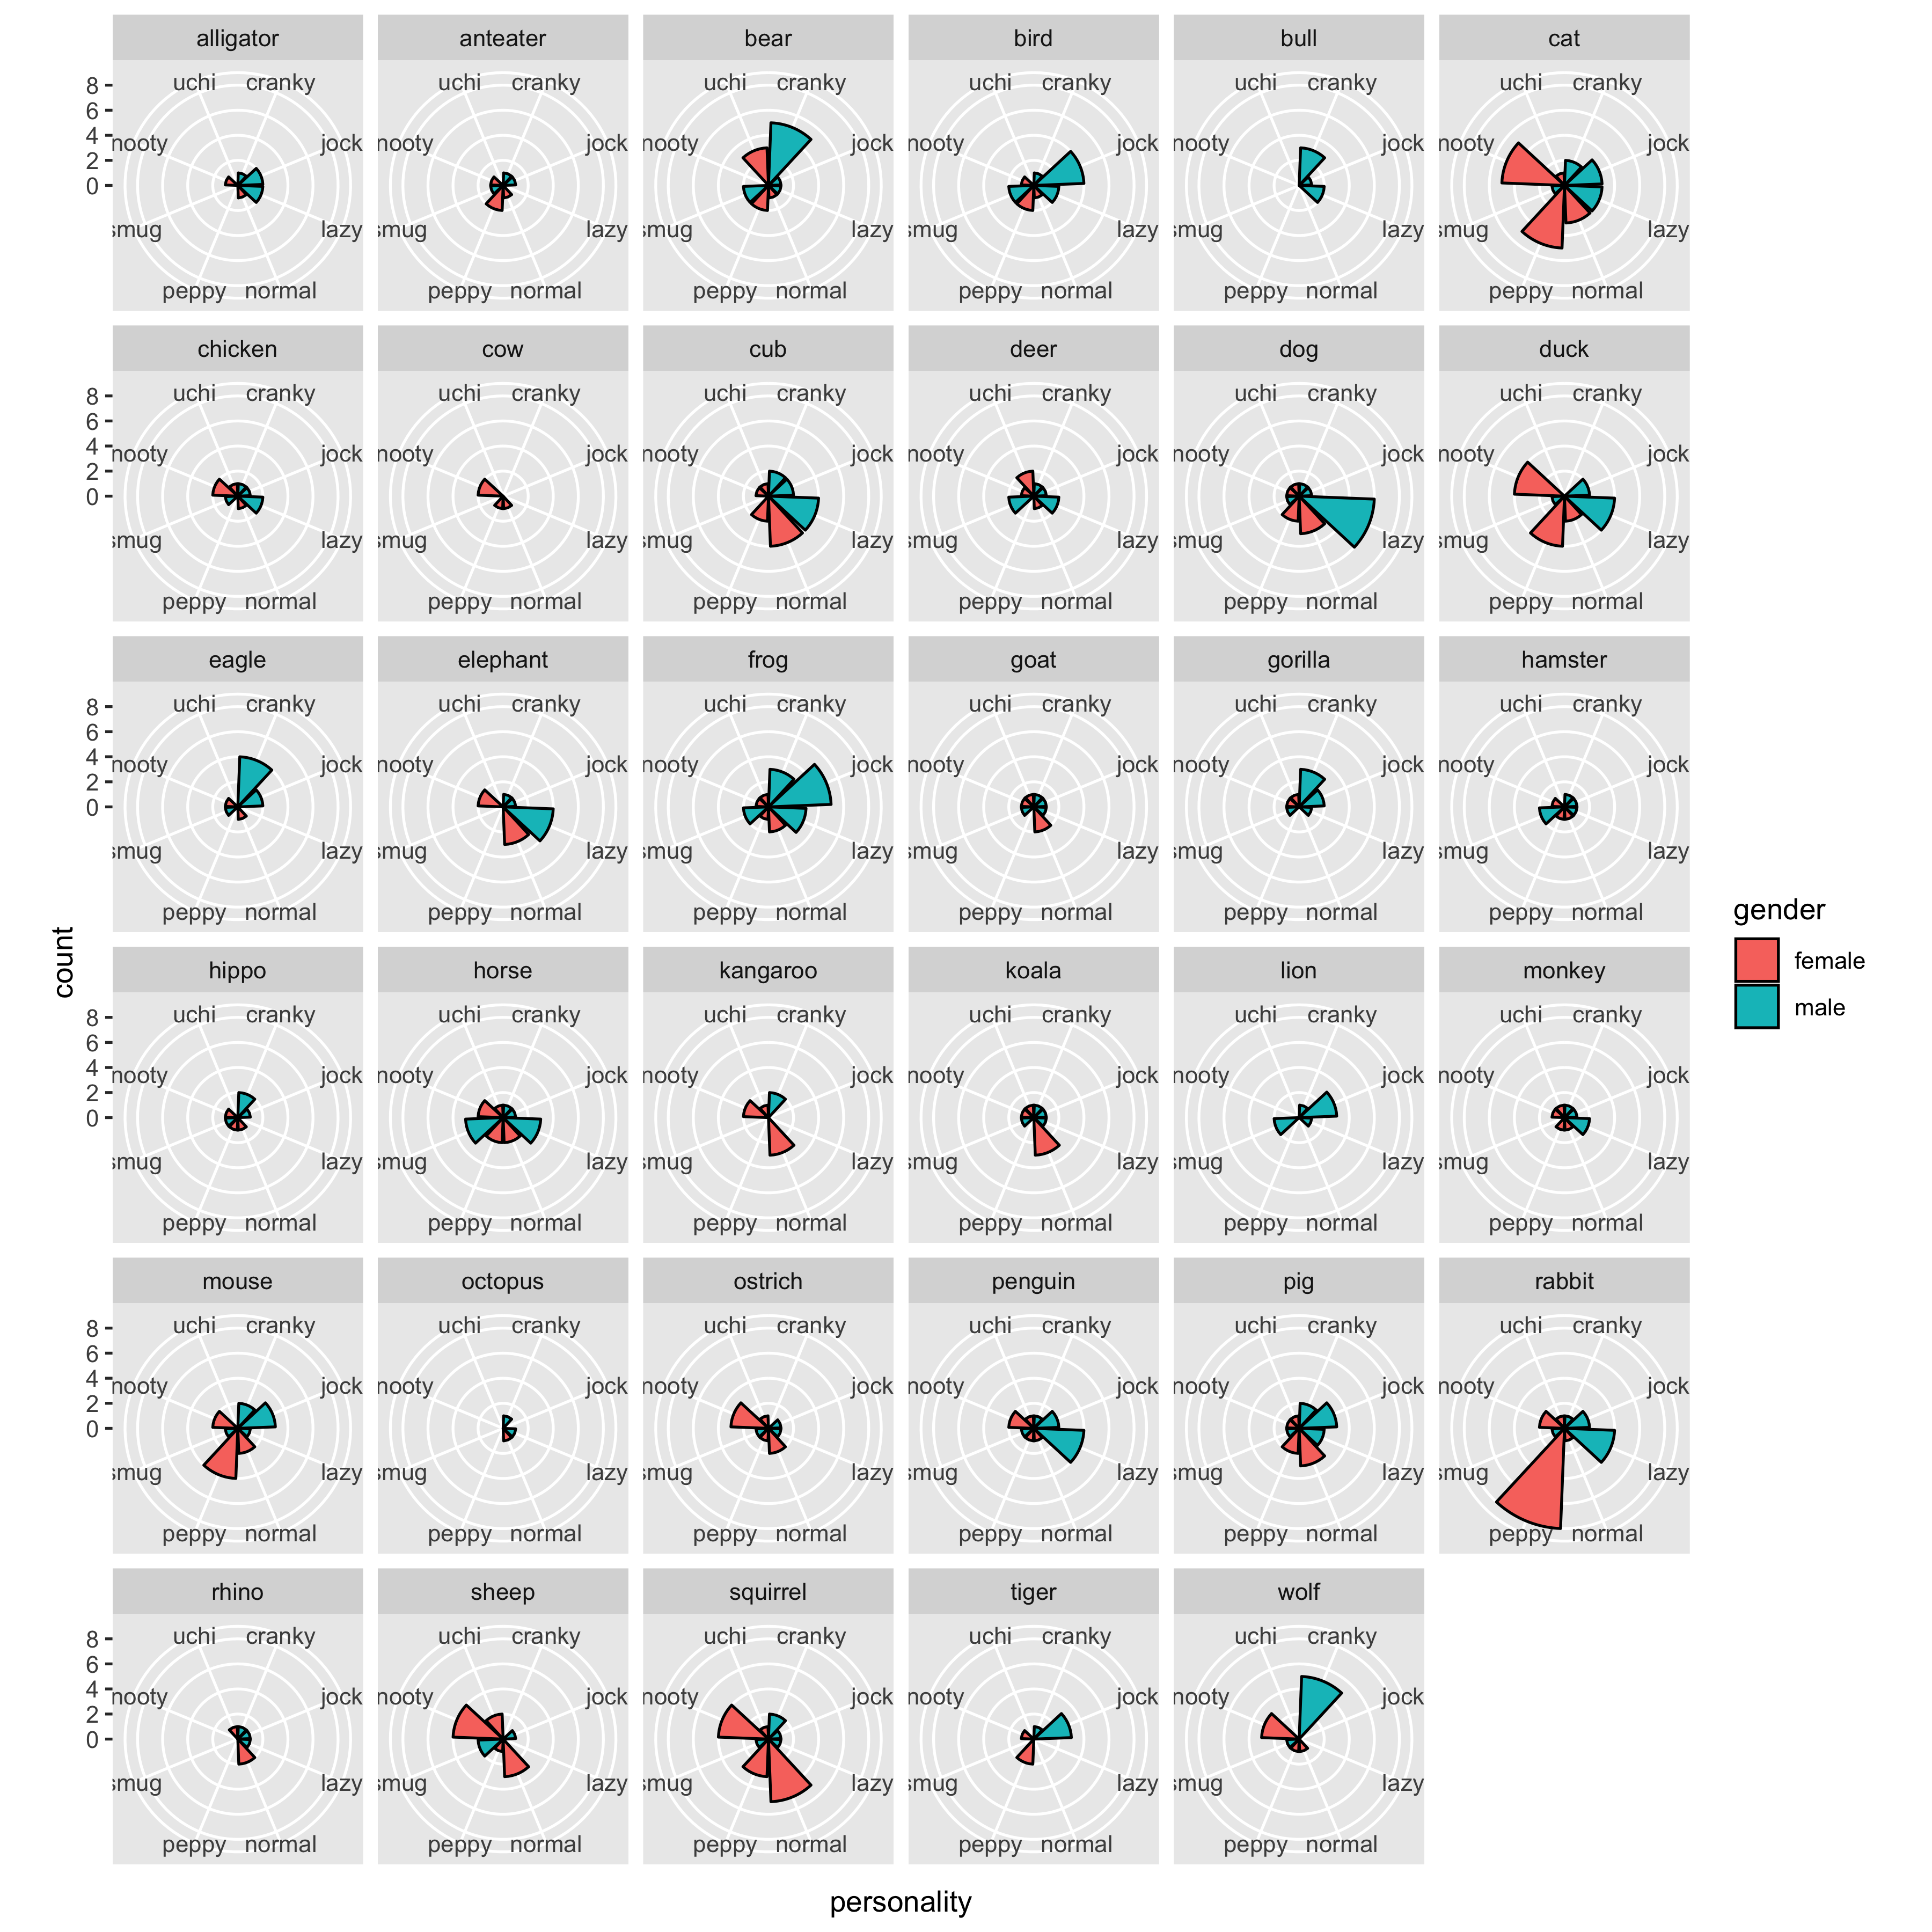
Question 5
Present a small multiples of p4, conditioning on species.
p5 <- p4 +
  facet_wrap(vars(species))
p5
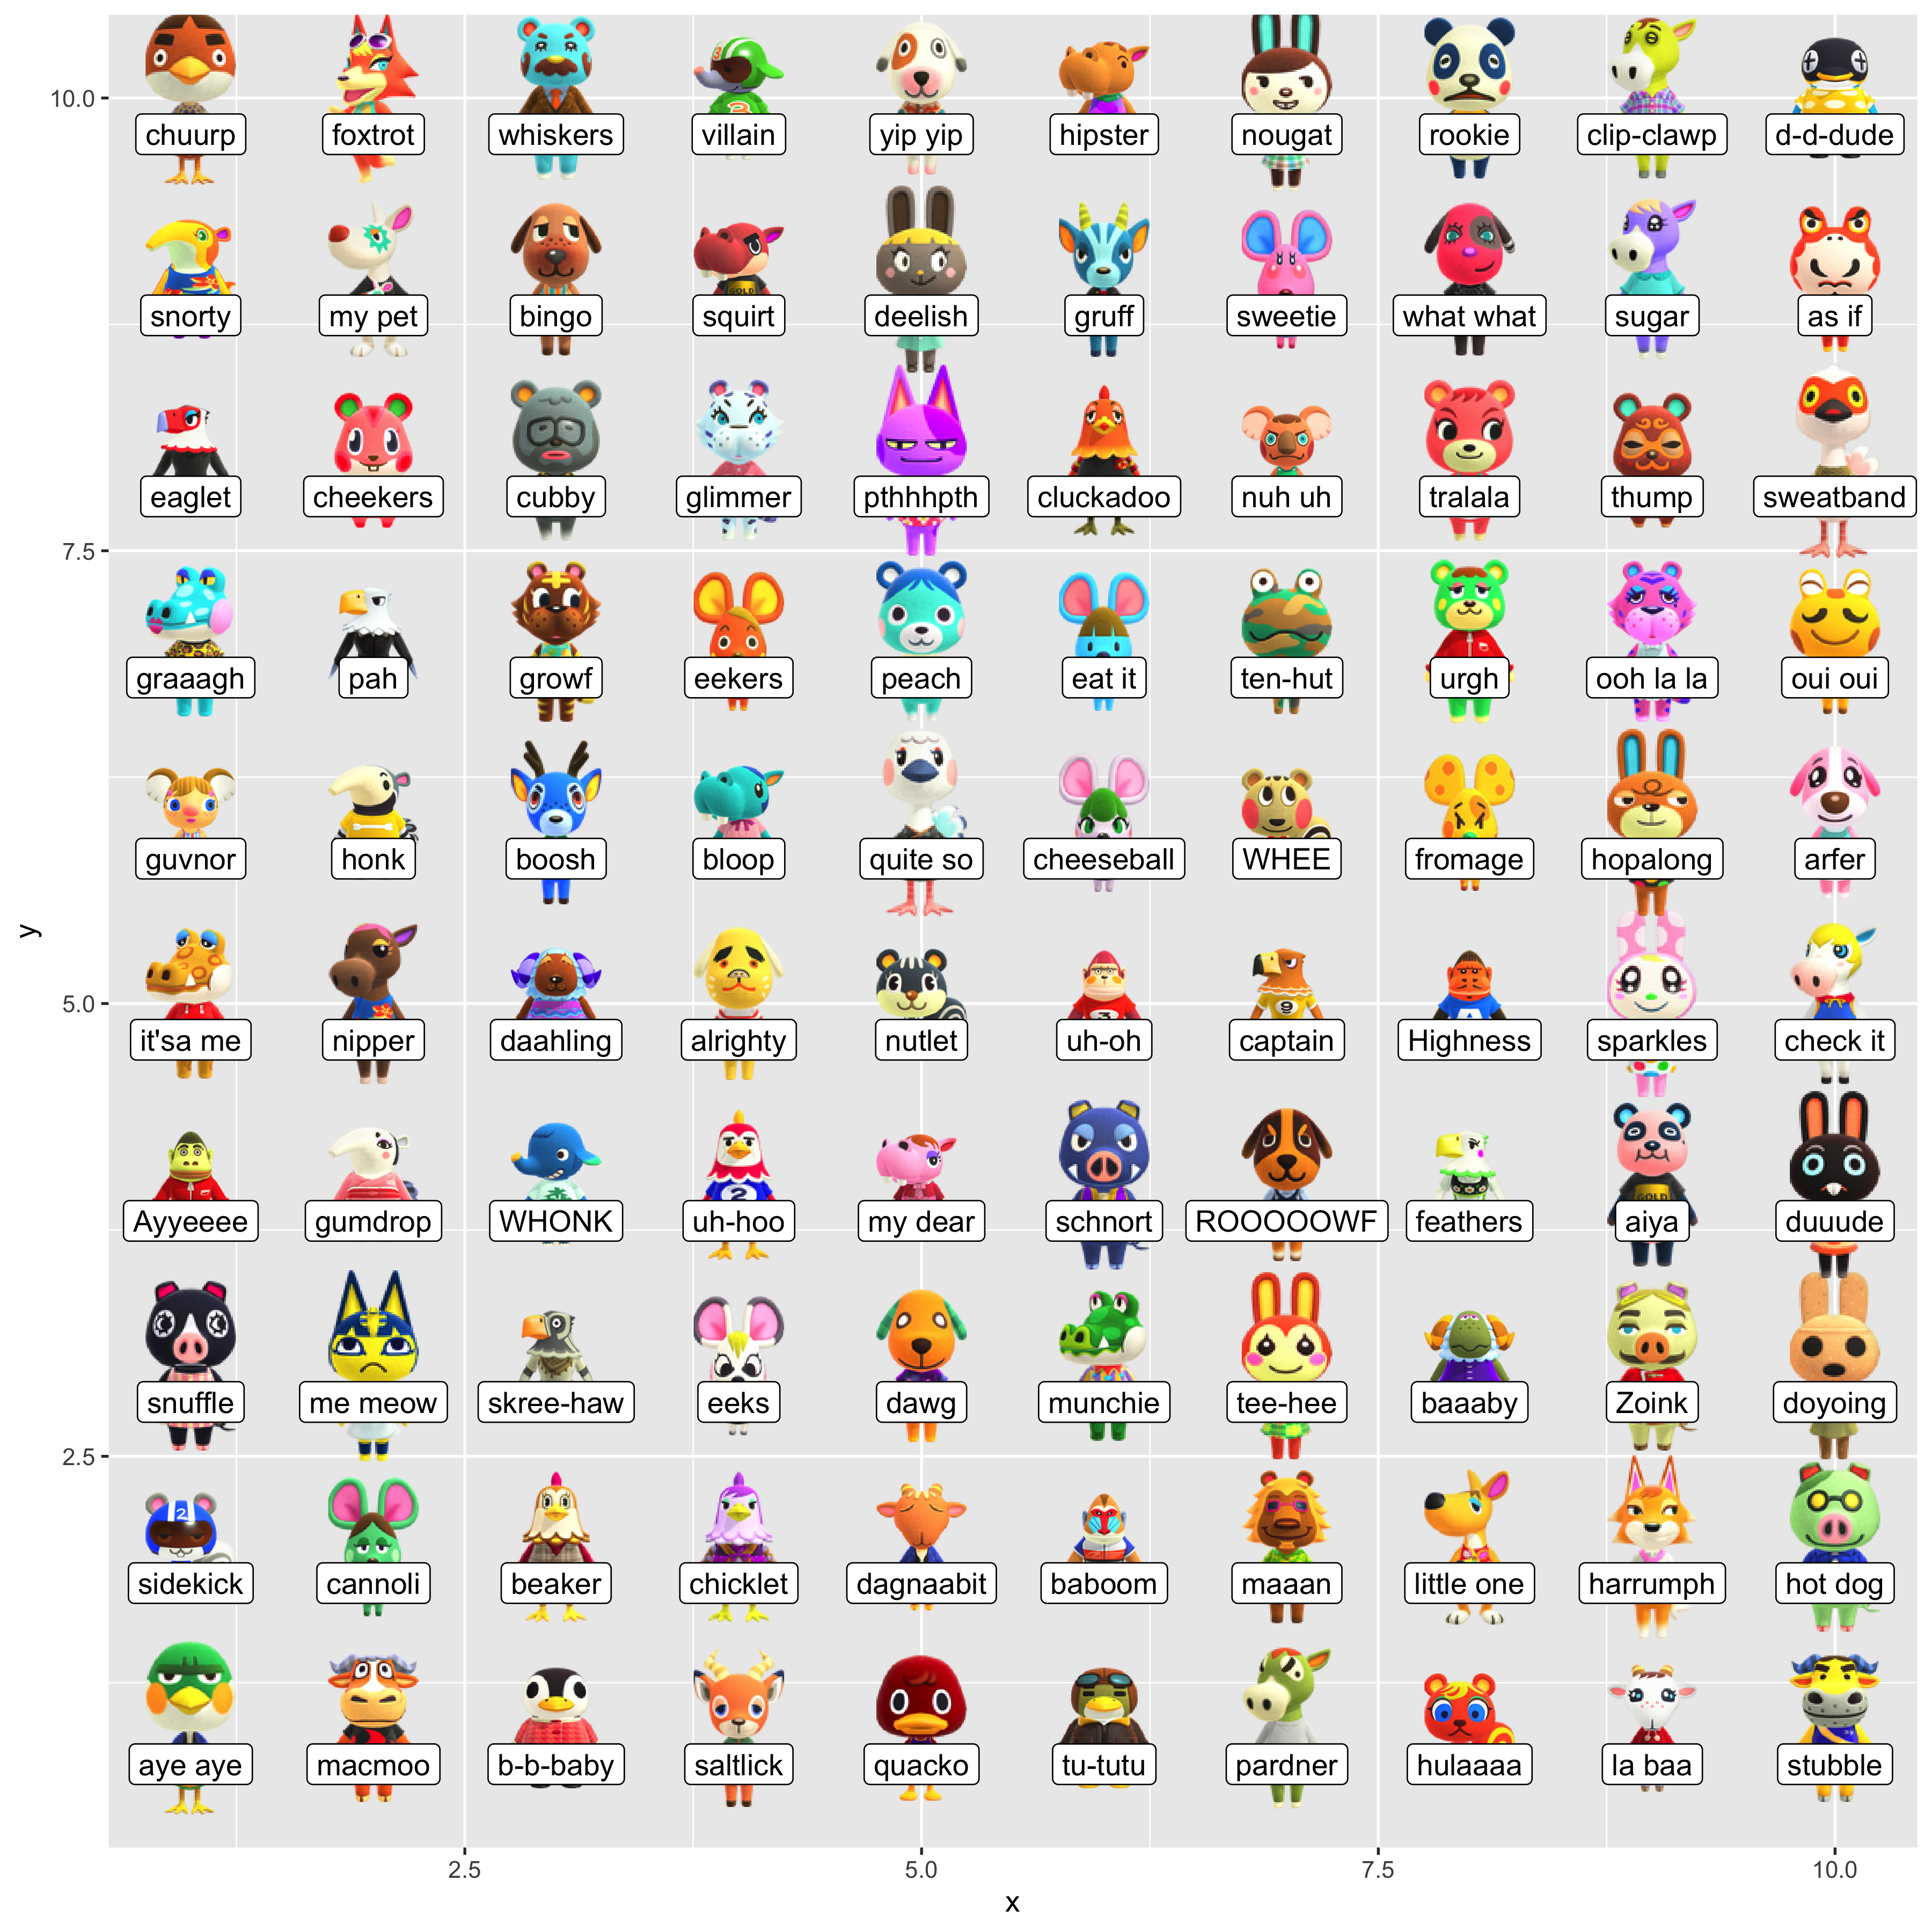
Question4fun (NO marks)
Reproduce the following figure:
- subset the first 100 rows from
villagers. - create a tibble with columns
xandy, that contains all combinations of the two vectors1:10and1:10. - bind the newly created tibble to the
villagerssubset. - plot these villagers’ images from
url, and label them withphrase.
library(ggimage)
villagers %>%
  slice(1:100) %>%
  bind_cols(expand_grid(x = 1:10, y = 1:10)) %>%
  ggplot(aes(x, y)) +
  geom_image(aes(image = url)) +
  geom_label(aes(label = phrase), nudge_y = -0.2)