Lab 06 Solution
This lab exercise is due 23:59 Monday 03 May (NZST).
- You should submit an R file (i.e. file extension
.R) containing R code that assigns the appropriate values to the appropriate symbols. - Your R file will be executed in order and checked against the values that have been assigned to the symbols using an automatic grading system. Marks will be fully deducted for non-identical results.
- Intermediate steps to achieve the final results will NOT be checked.
- Each question is worth 0.2 points.
- You should submit your R file on Canvas.
- Late assignments are NOT accepted unless prior arrangement for medical/compassionate reasons.
In this lab exercise, you are going to tidy domestic-trips.csv that
contains quarterly overnight trips from 1998 Q1 to 2016 Q4 across
Australia. You shall use the following code snippet (and include them
upfront in your R file) for this lab session:
library(tidyverse)
library(lubridate)
cn <- c("Quarter", "Region", "Holiday", "Visiting", "Business", "Other")
states <- c("New South Wales", "Victoria", "Queensland", "South Australia",
  "Western Australia", "Tasmania", "Northern Territory", "ACT")
Suppose that you have created an Rproj for this course. You need to
download domestic-trips.csv
here,
to data/ under your Rproj folder.
- You’re required to use relative file paths
data/domestic-trips.csvto import these data. NO marks will be given to this lab for using URL links or different file paths.
Question 1
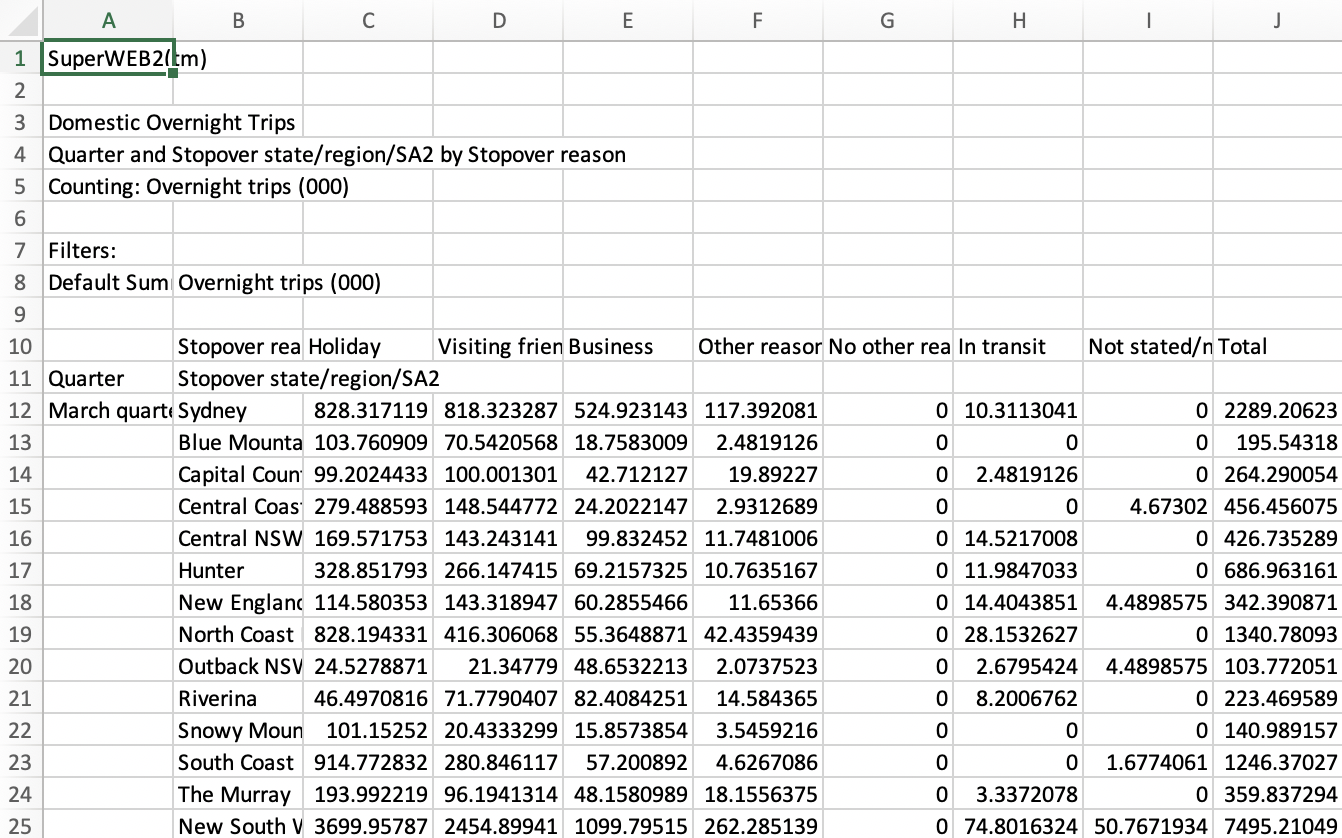
You’re highly recommended to open domestic-trips.csv with Excel or
Numbers, and inspect the data layout you’re going to tidy up. There are
two approaches to get domestic_trips as required:
- revisit
?read_csv()and use the appropriate arguments to importdata/domestic-trips.csvto R. - import
data/domestic-trips.csvwithout using the appropriate arguments, and wrangle the data to what is required.
You should end up with a tibble called domestic_trips.
domestic_trips <- read_csv("data/domestic-trips.csv",
  skip = 11, col_names = cn, n_max = 6804)
domestic_trips
#> # A tibble: 6,804 x 6
#>    Quarter          Region            Holiday Visiting Business  Other
#>    <chr>            <chr>               <dbl>    <dbl>    <dbl>  <dbl>
#>  1 March quarter 1… Sydney              828.     818.     525.  117.
#>  2 <NA>             Blue Mountains      104.      70.5     18.8   2.48
#>  3 <NA>             Capital Country      99.2    100.      42.7  19.9
#>  4 <NA>             Central Coast       279.     149.      24.2   2.93
#>  5 <NA>             Central NSW         170.     143.      99.8  11.7
#>  6 <NA>             Hunter              329.     266.      69.2  10.8
#>  7 <NA>             New England Nort…   115.     143.      60.3  11.7
#>  8 <NA>             North Coast NSW     828.     416.      55.4  42.4
#>  9 <NA>             Outback NSW          24.5     21.3     48.7   2.07
#> 10 <NA>             Riverina             46.5     71.8     82.4  14.6
#> # … with 6,794 more rows
Question 2
The values from Quarter only get changed when they are first recored
in the domestic_trips. Clean the Quarter column:
- filling missing values of the
Quartercolumn using the previous value - subsetting rows that
Quarteris not equal to"Total".
You should end up with a tibble called qtr_full.
qtr_full <- domestic_trips %>%
  fill(Quarter, .direction = "down") %>%
  filter(Quarter != "Total")
qtr_full
#> # A tibble: 6,720 x 6
#>    Quarter          Region            Holiday Visiting Business  Other
#>    <chr>            <chr>               <dbl>    <dbl>    <dbl>  <dbl>
#>  1 March quarter 1… Sydney              828.     818.     525.  117.
#>  2 March quarter 1… Blue Mountains      104.      70.5     18.8   2.48
#>  3 March quarter 1… Capital Country      99.2    100.      42.7  19.9
#>  4 March quarter 1… Central Coast       279.     149.      24.2   2.93
#>  5 March quarter 1… Central NSW         170.     143.      99.8  11.7
#>  6 March quarter 1… Hunter              329.     266.      69.2  10.8
#>  7 March quarter 1… New England Nort…   115.     143.      60.3  11.7
#>  8 March quarter 1… North Coast NSW     828.     416.      55.4  42.4
#>  9 March quarter 1… Outback NSW          24.5     21.3     48.7   2.07
#> 10 March quarter 1… Riverina             46.5     71.8     82.4  14.6
#> # … with 6,710 more rows
qtr_full %>%
  filter(Region %in% states)
#> # A tibble: 640 x 6
#>    Quarter            Region           Holiday Visiting Business Other
#>    <chr>              <chr>              <dbl>    <dbl>    <dbl> <dbl>
#>  1 March quarter 1998 New South Wales   3700.    2455.    1100.  262.
#>  2 March quarter 1998 Victoria          3025.    1827.     765.  128.
#>  3 March quarter 1998 Queensland        1850.    1123.     610.  109.
#>  4 March quarter 1998 South Australia    785.     511.     236.   75.0
#>  5 March quarter 1998 Western Austral…   725.     414.     366.   51.3
#>  6 March quarter 1998 Tasmania           427.     209.      98.4  18.1
#>  7 March quarter 1998 Northern Territ…    41.3     18.9     70.4  10.4
#>  8 March quarter 1998 ACT                196.     183.     150.   21.7
#>  9 June quarter 1998  New South Wales   2939.    2247.    1233.  216.
#> 10 June quarter 1998  Victoria          2066.    1536.     726.  132.
#> # … with 630 more rows
Question 3
Continue cleaning qtr_full:
- create a new column
Statewith values: whenRegionmatches the values ofstates, fill the corresponding values ofRegion; otherwise, fillNA_character_. - fill missing values of the
Statecolumn using the next value. - subset rows that
Regiondoesn’t match the values ofstates.
You should end up with a tibble called states_trips.
states_trips <- qtr_full %>%
  mutate(State = case_when(
    Region %in% states ~ Region, TRUE ~ NA_character_)) %>%
  fill(State, .direction = "up") %>%
  filter(!(Region %in% states))
states_trips
#> # A tibble: 6,080 x 7
#>    Quarter      Region       Holiday Visiting Business  Other State
#>    <chr>        <chr>          <dbl>    <dbl>    <dbl>  <dbl> <chr>
#>  1 March quart… Sydney         828.     818.     525.  117.   New Sou…
#>  2 March quart… Blue Mounta…   104.      70.5     18.8   2.48 New Sou…
#>  3 March quart… Capital Cou…    99.2    100.      42.7  19.9  New Sou…
#>  4 March quart… Central Coa…   279.     149.      24.2   2.93 New Sou…
#>  5 March quart… Central NSW    170.     143.      99.8  11.7  New Sou…
#>  6 March quart… Hunter         329.     266.      69.2  10.8  New Sou…
#>  7 March quart… New England…   115.     143.      60.3  11.7  New Sou…
#>  8 March quart… North Coast…   828.     416.      55.4  42.4  New Sou…
#>  9 March quart… Outback NSW     24.5     21.3     48.7   2.07 New Sou…
#> 10 March quart… Riverina        46.5     71.8     82.4  14.6  New Sou…
#> # … with 6,070 more rows
states_trips %>%
  count(State)
#> # A tibble: 8 x 2
#>   State                  n
#>   <chr>              <int>
#> 1 ACT                   80
#> 2 New South Wales     1040
#> 3 Northern Territory   560
#> 4 Queensland           960
#> 5 South Australia      960
#> 6 Tasmania             400
#> 7 Victoria            1680
#> 8 Western Australia    400
Question 4
Pivot states_trips from wide to long format, with names to "Purpose"
and values to "Trips".
You should end up with a tibble called tidy_trips.
tidy_trips <- states_trips %>%
  pivot_longer(Holiday:Other, names_to = "Purpose", values_to = "Trips")
tidy_trips
#> # A tibble: 24,320 x 5
#>    Quarter            Region          State           Purpose   Trips
#>    <chr>              <chr>           <chr>           <chr>     <dbl>
#>  1 March quarter 1998 Sydney          New South Wales Holiday  828.
#>  2 March quarter 1998 Sydney          New South Wales Visiting 818.
#>  3 March quarter 1998 Sydney          New South Wales Business 525.
#>  4 March quarter 1998 Sydney          New South Wales Other    117.
#>  5 March quarter 1998 Blue Mountains  New South Wales Holiday  104.
#>  6 March quarter 1998 Blue Mountains  New South Wales Visiting  70.5
#>  7 March quarter 1998 Blue Mountains  New South Wales Business  18.8
#>  8 March quarter 1998 Blue Mountains  New South Wales Other      2.48
#>  9 March quarter 1998 Capital Country New South Wales Holiday   99.2
#> 10 March quarter 1998 Capital Country New South Wales Visiting 100.
#> # … with 24,310 more rows
Question 5
Convert the Quarter column of tidy_trips from character to date.
You should end up with a tibble called qtr_trips.
qtr_trips <- tidy_trips %>%
  mutate(Quarter = parse_date(Quarter, "%B quarter %Y"))
qtr_trips
#> # A tibble: 24,320 x 5
#>    Quarter    Region          State           Purpose   Trips
#>    <date>     <chr>           <chr>           <chr>     <dbl>
#>  1 1998-03-01 Sydney          New South Wales Holiday  828.
#>  2 1998-03-01 Sydney          New South Wales Visiting 818.
#>  3 1998-03-01 Sydney          New South Wales Business 525.
#>  4 1998-03-01 Sydney          New South Wales Other    117.
#>  5 1998-03-01 Blue Mountains  New South Wales Holiday  104.
#>  6 1998-03-01 Blue Mountains  New South Wales Visiting  70.5
#>  7 1998-03-01 Blue Mountains  New South Wales Business  18.8
#>  8 1998-03-01 Blue Mountains  New South Wales Other      2.48
#>  9 1998-03-01 Capital Country New South Wales Holiday   99.2
#> 10 1998-03-01 Capital Country New South Wales Visiting 100.
#> # … with 24,310 more rows
mean(qtr_trips$Quarter)
#> [1] "2008-01-15"